
The reaction to Nvidia’s last report was a gain of 8.7%. The three reports before that were all losses. Sales have grown by more than 60% a year for most of the last two years, and the stock still fell on report day more often than it rose. That pattern tells you more about where Nvidia stands than any single quarter does.
The forecast question has changed. Two years ago it was whether the AI buildout was real, and it was. Now it is what the market will pay for earnings that are huge and no longer a surprise. At about $222, the stock is priced somewhere in the middle of the sensible answers.
A business that rebuilt itself in three years
The financials tab shows fiscal 2023 revenue of $27.0 billion, flat on the year before. Fiscal 2024 came in at $60.9 billion, fiscal 2025 at $130.5 billion, and fiscal 2026, the year that ended in January, at $215.9 billion, up 65%. Net income for that last year was $120.1 billion, about 56 cents of every sales dollar. Operating margin was 60%.
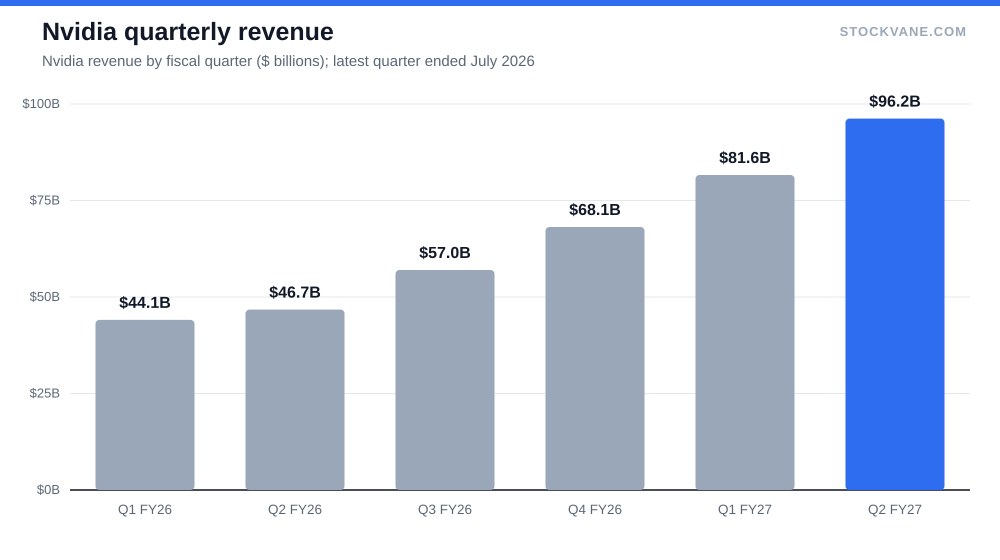
Those are the numbers of a business that stopped being a chip company some time ago. The most recent quarter, the one that ended in July, brought in $96.2 billion, up 106% on the year. The three quarters before it grew 62%, 73% and 85%. Each of the last three added roughly a fifth to the quarter before it, 18% in the latest, so the growth in dollars is still large even as the sequential percentage slips a little.
Compute and networking made $88.3 billion of the latest quarter and graphics $7.9 billion. If you still think of Nvidia as a gaming company, the split is the fastest way to fix that.
The run has reversed before. In fiscal 2023 revenue went nowhere and net income fell 55%, from $9.8 billion to $4.4 billion, after the earlier boom in gaming and mining demand faded. I am not predicting a repeat, but the same company posted a profit collapse only three years before it posted $120 billion, and the market remembers.
Where the margin went
Gross margin is the number that gets less attention than it deserves. It was 75.0% in fiscal 2025 and 71.1% in fiscal 2026, a drop of almost four points on a business that grew by two thirds. I do not have the company’s explanation in front of me, so I will not pretend to know whether it reflects product mix, costlier new systems or something else. What I can say is that a 71% gross margin on $216 billion of sales is still a number few companies of any kind have reported.
The direction is worth watching, because the earnings forecast rests on it. If margins hold near current levels, the growth in profit follows the growth in sales. If they slide another few points, profit growth will trail revenue growth, and the multiple people will pay for that profit shrinks with it. For scale, one point of gross margin on a $385 billion run rate is about $3.8 billion of gross profit a year, so a four-point slide like last year’s would cost the company around $15 billion at today’s volume.
What the multiple is saying
The valuation tab shows a trailing P/E of 28.1. Nvidia’s five-year average is 72.7, and the stock now sits at the bottom of its own five-year range. That looks dramatic, but the average is inflated by the early part of the boom, when earnings were small and hopes were large. I would not treat it as a bargain signal by itself.
The forward P/E is the better guide. At 18.1, it implies analysts expect about $12.3 a share of earnings over the next year, against about $7.91 over the last twelve months. That is a gain of about 55%, and it is the assumption the whole valuation leans on. Put differently, the market is not charging much for growth that has already happened. It is charging for growth that the analysts have penciled in.
Last quarter’s revenue, multiplied by four, gives about $385 billion of sales a year. At a market value of $5.4 trillion, the stock trades near 14 times that run rate. It is a large number for a hardware company, and a small one next to the 26 times sales Nvidia averaged over five years.
What the price could do
A forecast for a stock like this is a statement of what you would have to believe. Start from the $12.3 of forward earnings the price implies, allow for less if growth disappoints and more if it does not, and multiply by the P/E the market might pay.
| Forward EPS Multiple | 16x earnings | 20x earnings | 24x earnings |
|---|---|---|---|
| $9.5 a share | $152 | $190 | $228 |
| $12.3 a share | $197 | $246 | $295 |
| $15.0 a share | $240 | $300 | $360 |
At the current price, the market is paying about 18 times my middle earnings case. To justify the price at 16 times, earnings would need to reach about $13.9. The bottom of the grid needs earnings near $9.50 and a multiple of 16. The top needs $15 and 24 times. Each corner is possible, and each depends on two things going a particular way at once.
I will not put a single number on where Nvidia ends the year. My range is roughly $150 to $360, and I hold it loosely, since one wrong assumption about margins or the multiple moves the answer by more than 20%.
Who is betting against it
Not many people. The latest short interest report, dated August 31, put shares sold short at about 1.2% of the float, with roughly 2.1 days needed to cover. For a $5 trillion company that is a small number in absolute terms and a tiny one in relative terms. It tells me the downside case is not being pushed by a crowded bet against the stock, which cuts two ways: there is no short squeeze waiting to lift the price, and there is no pool of skeptics who would need to be proven wrong before the shares can rise.
Analysts and the model disagree
All 30 analysts covering Nvidia rate it a buy, and none rate it a hold or sell. The analyst consensus average target of $324 sits about 46% above the price, and even the lowest target, $275, is 24% above it. The highest is $465.
A unanimous buy list is not evidence of a mistake. It does mean the view is crowded, and when everyone already agrees the next buyer is harder to find. The quant rating on the same page tells a more cautious story: it graded Nvidia a B with a score of 81 on September 8 and a C with a score of 59 on the latest date. That is a fall of 22 points in under two weeks. The model works from price and valuation data, so I read it as a comment on how the stock has traded and not on what the business earns.
| Metric | Value | Context |
|---|---|---|
| Price (approx.) | $222.27 | 52-week range $164 to $236 |
| P/E (TTM) | 28.1x | Five-year average 72.7x |
| Price-to-sales | 17.7x | Five-year average 26.1x |
| Analyst ratings | 100% buy, 0% hold | 30 analysts; average target $324 |
| Dividend yield | 0.13% |
What has to go right
The forecast rests on customers continuing to buy at the current pace. That depends on the spending plans of a small group of the largest buyers, and we looked at who receives that money in our AI infrastructure breakdown and at whether it resembles 1999 in a piece on the capex cycle. Margins also have to stay near current levels, and the market has to keep paying a double-digit multiple for a company that has already grown enormously.
Customer concentration is the piece I cannot measure well from our data. A handful of the largest cloud and internet companies account for a big share of demand, and they set their own budgets each year. If two or three of them decided to slow orders in the same quarter, the run rate would stop being a run rate. It is a reason to prefer a position size that survives that quarter, and I would say the same about any supplier with customers that large.
The reports themselves show how the market is behaving. Over the last four, the shares moved +8.7%, -1.8%, -5.5% and -3.2%, an average move of about 4.8% in either direction. Three of those four days were declines, on reports that showed sales growth of 62% or better. A stock that falls on 73% growth is telling you what is already in the price.
What would change my mind
I would get more cautious if quarterly revenue growth slid below 50% while margins kept falling. I would get more constructive if the price fell toward the low end of my range without the earnings forecast changing, because a lower price on the same profit is a better deal by definition.
Growth is the condition I can judge best from outside. Sequential growth has slowed from about 20% a quarter to 18%, which is still fast, but the percentage will keep shrinking as the base grows. A business that adds $15 billion of revenue in a quarter has to find $17 billion next time just to hold the same rate, and the buyers who supply that money are the same ones already stretching their budgets.
Until one of those happens, I would neither add nor sell. My price to add is near $185, which is 15 times the $12.3 middle case, about 17% below the current price and above the 52-week low of $164. Above that, Nvidia is a good business priced for the outcome most people already expect.
Financial disclaimer: The content on StockVane is for educational and informational purposes only and should not be construed as professional financial advice. Stock market investing involves risk of loss.
Pingback: Everyone Is Bullish on Apple Stock Right Now, That’s Exactly Why I’m Not – StockVane
Pingback: AI Infrastructure Stocks 2026: Who Profits From the $700 Billion Spending Wave – StockVane