Look up any US stock in seconds
A 22-factor quant score, full financials, valuation vs. history, analyst targets and dividend record on every name: plus plain-English analysis and free calculators.
Market snapshot
Where the market sits today: our quant score, factor read and the most-watched names.
Market Quant Score
S&P 500 (via SPY) 761.69 +0.13%
As of Sep 23, 2026 · updated daily, not real-time
Factor breakdown
Tracked-universe average (100 stocks): valuation percentile, price momentum, analyst consensus - the same 3 inputs behind every stock's own Quant Rating.
Quant Score is a StockVane algorithm computed from valuation, price momentum and analyst consensus data - not a live AI model, not investment advice. stockvane.com
Trending stocks
The 10 most actively traded names today, by turnover.
| Name | Last | Chg% | Turnover | Quant Rating | Mkt cap | P/E (TTM) |
|---|---|---|---|---|---|---|
| NVIDIAUS.NVDA | 222.27 | +1.34% | 42.07B | 5.36T | 28.10 | |
| Micron TechnologyUS.MU | 1,015.80 | +3.92% | 35.85B | 1.15T | 22.96 | |
| SanDiskUS.SNDK | 1,791.82 | +10.99% | 30.86B | 262.36B | 24.29 | |
| AppleUS.AAPL | 336.13 | -0.26% | 29.10B | 4.91T | 38.55 | |
| Bloom EnergyUS.BE | 265.63 | -5.39% | 19.62B | 78.24B | 344.97 | |
| MicrosoftUS.MSFT | 493.78 | -0.80% | 19.59B | 3.67T | 27.51 | |
| IntelUS.INTC | 108.60 | -0.18% | 18.97B | 570.53B | -51.96 | |
| TeslaUS.TSLA | 364.27 | -0.53% | 18.94B | 1.44T | 337.29 | |
| Meta PlatformsUS.META | 665.75 | -2.43% | 18.55B | 1.70T | 25.08 | |
| Advanced Micro DevicesUS.AMD | 559.82 | +2.70% | 17.61B | 913.89B | 143.54 |
Today on the market
The day’s biggest moves, plus quick ways in: screener, ranked lists, side-by-side comparison and how our Quant Rating has held up.
Free calculators
No sign-up, no ads in the result, just the math.
Explore by theme
Curated baskets, from AI infrastructure to the Pelosi portfolio.
Latest analysis
Forecasts, broker reviews and how-to guides from our desk.
- UPS Pays a 6% Yield. The Coverage Ratio Says How Safe That Really Is.
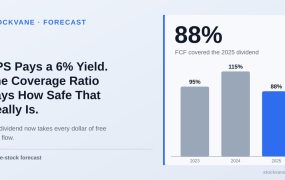 UPS paid $5.4 billion in dividends in 2025 against $4.8 billion of free cash flow and borrowed to cover the gap. At a 6.6% yield the payout is covered by adjusted earnings, not by cash. Here is where the cushion went and what to watch.
 - Amgen Is 14% Below Its High and Yields 2.5%. Fairly Priced for a Steady Grower.
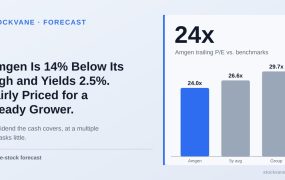 Amgen trades 14% below its high at 24 times earnings, under its own average, with a 2.5% dividend yield. Here is what the multiple asks you to believe, how much cash covers the payout, and the price where I would want to own it.
 - The Quant Model Is Cooler on Mastercard Than Wall Street Is
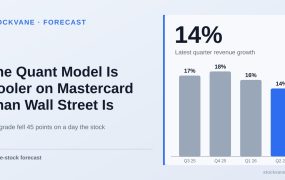 Mastercard’s momentum grade fell from C to D in one day while the stock rose, and Visa did the same. The business still grows 14%, but growth has slowed three quarters running and the multiple has already dropped. Here is what the D means.
 - Broadcom’s AI Backlog Is the Real Story. The Networking Business Is the Proof.
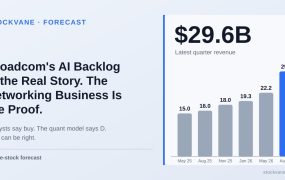 Broadcom’s revenue jumped 86% last quarter and analysts rate it a buy almost unanimously, yet StockVane’s quant model grades it a D. At about 40 times run-rate earnings, here is what each side is measuring and how I would size the position.
 - Four Big Reports Before October 2: Cintas, Costco, Micron and Accenture
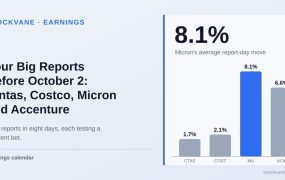 Cintas, Costco, Micron and Accenture report within eight days and are worth about $1.7 trillion together. Each report tests a different assumption, from steadiness to a 346% revenue surge. Here is what each price already expects.
 - S&P 500 vs. Nasdaq-100: Which Index ETF Actually Fits Your Portfolio
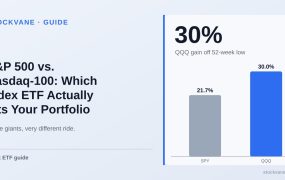 SPY and QQQ hold many of the same giants, yet QQQ has climbed 30% off its 52-week low against 22% for SPY. Here is what each fund really owns, where the overlap hides, and how to decide which one deserves your money first.