
Which of these four would you rather own on the morning of the report? Cintas, Costco, Micron and Accenture all report within eight days of each other, they share almost nothing in their businesses, and the answer says a lot about what you think a stock price is supposed to be doing before a number arrives.
Together the four are worth about $1.7 trillion, and Micron is $1.1 trillion of that. Cintas reports on September 23, Costco on September 24, Micron on September 30 and Accenture on October 1. I think each one is testing a different assumption, and that is the reason to read them side by side and not one at a time.
| Company | Reports | Session | P/E now | Forward P/E | Latest quarter revenue growth | Avg move, last 4 reports |
|---|---|---|---|---|---|---|
| Cintas (CTAS) | September 23 | Not stated | 40.3 | 35.7 | +8.9% | 1.7% |
| Costco (COST) | September 24 | After close | 45.0 | 41.3 | +11.6% | 2.1% |
| Micron (MU) | September 30 | After close | 23.0 | 6.8 | +345.7% | 8.1% |
| Accenture (ACN) | October 1 | Before open | 14.5 | 13.2 | +5.6% | 6.6% |
Four reports, four different bets
The table above is the calendar with the key ratios. Cintas and Costco trade at a premium to their industry groups because their results rarely surprise. Micron has a forward multiple that assumes a growth rate almost no chip company has sustained. Accenture has no premium left at all. A quarter that would be a triumph for one of them is a non-event for another, so I would not hold them to the same yardstick.
I will take them in date order and show the arithmetic as I go, since a forward multiple only means something once you see the earnings it implies.
Cintas, September 23: paying for boring
Cintas rents uniforms and supplies to businesses, and it has grown quarterly revenue between 6.8% and 9.3% in each of the last eight quarters, with the last three landing within a few tenths of 9%. The valuation tab shows a trailing P/E of 40.3, below its five-year average of 43.8 and about 54% above the 26.1 of its industry group. Forward P/E comes to 35.7.
This is the first quarter of the new fiscal year, set against $2.72 billion of revenue a year ago. Growth of 9% would put it near $2.96 billion, and I would treat that as the base case the price already knows. Earnings per share were $1.20 in the year-ago quarter and $1.26 in the most recent one, up 15.6%.
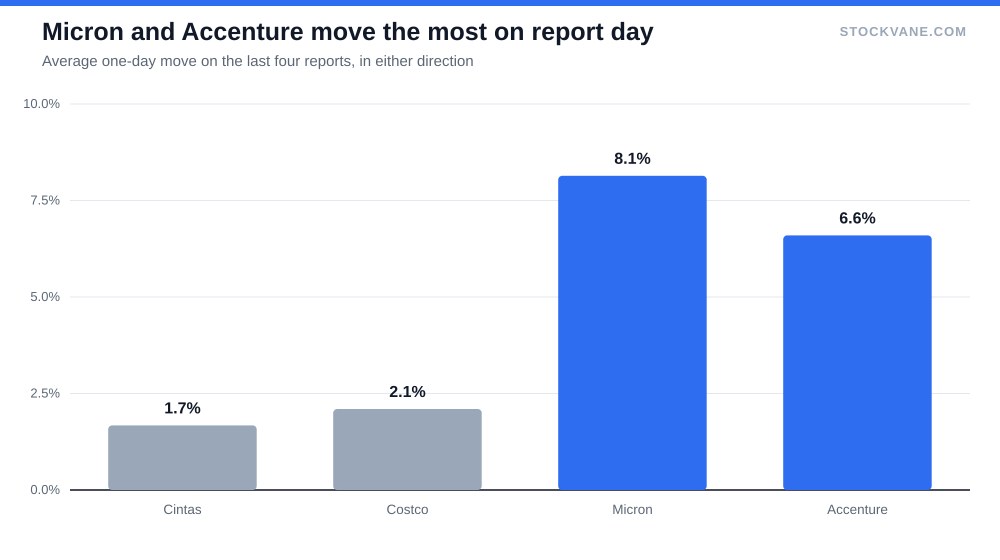
Its last four reports moved the stock +4.4%, -0.7%, +1.3% and -0.3%, an average swing of about 1.7%. At 40 times earnings, a company that only ever grows 9% has to keep doing exactly that. A beat adds little, and a slip in margin or organic growth costs more than the same-sized beat would earn.
Costco’s extra weeks
Costco’s fiscal fourth quarter has 16 weeks, not the usual 12, so revenue will look far larger than the third quarter did. Last year it was $86.16 billion in the fourth quarter against $63.2 billion in the third. The mistake to avoid is comparing the new number with the previous quarter. The only fair comparison is the year-ago fourth quarter.
Growth has been 8.3%, 9.2% and 11.6% over the last three quarters, so it is accelerating. At 9% to 12% growth, this quarter lands between about $93.9 billion and $96.5 billion. That is arithmetic and I am not forecasting. Earnings per share were $5.87 a year ago, and a repeat of the latest 15.2% growth rate would put it near $6.76.
The odd part is that the stock has slipped while growth improved. At $895 it sits about 18% below its 52-week high of $1,095, and it trades at 45.0 times earnings, 27% above its group. I argued in my piece on Costco at 50 times earnings that the multiple is the whole story, and I still think so. Its last four reactions were -3.9%, +1.6%, 0.0% and -2.9%, and none of them was a rally.
Micron: a forward multiple that needs another leap
Micron is the outlier by a wide margin. Last quarter’s revenue was $41.46 billion, up 346% from a year earlier, and it followed $23.86 billion and $13.64 billion in the two quarters before. That is roughly 75% sequential growth twice in a row. Earnings per share were $24.67 for the quarter.
The valuation tab shows a trailing P/E of 23.0, which looks cheap, and a forward P/E of 6.8, which looks nearly free. Run the arithmetic, though, and the second number stops looking like a bargain. At about $1,016 a share, a 6.8 multiple implies earnings near $150 a share over the next year, against about $44 over the last four quarters. If that forward figure covers the next twelve months, as I read it, then analysts expect roughly $37.5 a quarter on average, about 52% above the $24.67 just reported. The price already contains growth that steep.
The stock is up 558% from its 52-week low of $154 and still 19% below its high of $1,255. Its trailing P/E is well below its semiconductor group’s 32.0, and well above its own five-year average of 13.5. Those two facts point in opposite directions, which is my honest way of saying I do not know which comparison the market will use on the day. Analysts are 97% buy with an average target about 54% above the price. The quant model grades it an A with a perfect 100, a score that summarizes how the stock has traded and says nothing about the business.
The last four reactions were +15.7%, -3.8%, +10.2% and -2.8%. That is an average swing of 8.1%, by far the largest of the four. When a stock has climbed this far, results well above last year can still fail to lift it.
Accenture, October 1
Accenture fell 18.0% the day after its June report. It now trades near $181, about 36% under its 52-week high of $285, at 14.5 times earnings. That is roughly half its own five-year average of 26.8 and in line with the 15.5 of its group. I wrote about the setup at length in the Accenture piece on this site, so I will keep this section short.
Revenue held up. Last quarter came in at $18.72 billion, up 5.6%, and net income rose 6.4%. What changed was the multiple. When a services firm drops from a premium to an ordinary valuation, the market has stopped believing growth will stay above average, and meeting the numbers will not undo that. The report has to change the story.
Only 56% of analysts rate it a buy, the rest say hold, and the average target is about 3% above the price. The quant model grades it an E. It is the least loved of the four, and it has the largest drop to recover, which makes it the report where a modest surprise could move the most.
What each stock has to prove
Put the four on one screen and the premiums line up neatly. Cintas and Costco trade above their industry groups, Micron trades below its group but far above its own history, and Accenture trades in line with its group and well under its history.
| Company | Trailing P/E | Five-year average | Industry group | Analysts rating buy | Average target vs. price |
|---|---|---|---|---|---|
| Cintas | 40.3 | 43.8 | 26.1 | 75% | +12% |
| Costco | 45.0 | 46.9 | 35.4 | 68% | +21% |
| Micron | 23.0 | 13.5 | 32.0 | 97% | +54% |
| Accenture | 14.5 | 26.8 | 15.5 | 56% | +3% |
The analyst columns tell a similar story from a different angle. Micron carries the widest gap between price and target, and it comes with nearly unanimous buy ratings, which is a lot of agreement to hold before a report. Accenture has the narrowest gap and the most hold ratings. Micron has to be right. Accenture only has to stop being wrong, which is an easier job for one quarter.
Distance from the 52-week high adds one more angle. Accenture is the deepest at about 36%, and Cintas the shallowest at about 10%. Costco and Micron sit at nearly the same distance, about 18% and 19%, for opposite reasons: one has drifted lower while its growth improved, the other has fallen back after a huge run.
How I would read the first hour
I would not judge any of these on the headline.
Cintas first: organic growth and margin, because the multiple depends on both. At Costco, compare against the year-ago 16-week quarter and check membership renewals before looking at the reaction. Micron gets the guidance line before the quarter itself, since a forward multiple prices what comes next and not what just happened. Accenture is about bookings, which show whether the June slowdown was a one-off. If you want a refresher on how to read these releases, my earnings report guide covers the order I use.
If I could watch only one of the four, it would be Micron’s guidance. The forward multiple assumes roughly $37 a share of earnings in each of the next four quarters, so a forecast below that reads as a miss even if the quarter itself beats. Cintas and Costco have moved too little on their last eight reports for me to expect anything different this time, and Accenture’s 18% drop in June suggests the market is braced for bad news. Micron is the one where the price has left no margin. For Costco, the line I would check is fourth-quarter earnings per share against the $6.76 that 15% growth implies. Anything well below that would mean the faster sales never reached profit.
Financial disclaimer: The content on StockVane is for educational and informational purposes only and should not be construed as professional financial advice. Stock market investing involves risk of loss.