
United Parcel Service paid out $5.4 billion in dividends last year and produced $4.8 billion of free cash flow. That is a $0.6 billion gap, and the company covered it with borrowing. The stock yields 6.6% at $99.06, and that yield is the reason people look at UPS at all, so the gap is the number I would look at first.
I do not think the dividend is about to be cut. Management has held it flat at $1.64 a quarter for seven straight payments, revenue turned up in the latest quarter, and the company says its big restructuring is finished. But the cushion that once made the payout look automatic is gone, and the yield is now paying you for that. Whether 6.6% is a fair price for it depends on what happens over the next few quarters.
Two lines that stopped matching
The financials tab shows free cash flow, which is operating cash flow minus capital spending. In 2025 UPS generated $8.4 billion from operations, spent $3.7 billion on planes, vehicles and buildings, and was left with $4.8 billion. Dividends paid that year were $5.4 billion. Free cash flow covered 88% of the payout.
| Year | Free cash flow | Dividends paid | Free cash flow as % of dividends |
|---|---|---|---|
| 2021 | $10.8B | $3.4B | 315% |
| 2022 | $9.3B | $5.1B | 183% |
| 2023 | $5.1B | $5.4B | 95% |
| 2024 | $6.2B | $5.4B | 115% |
| 2025 | $4.8B | $5.4B | 88% |
| 2023 to 2025 combined | $16.1B | $16.2B | 99% |
Look at how that ratio moved. In 2021 the business threw off more than three times what it paid to shareholders. In 2022 the dividend jumped by about half, from $3.4 billion to $5.1 billion, while free cash flow fell, and coverage dropped to 183%. Since then it has bounced around the 100% line: 95% in 2023, 115% in 2024, 88% last year. Add up the three years and UPS earned $16.1 billion in free cash flow against $16.2 billion in dividends, which is 99%. Over three years the dividend has consumed everything the business had left.
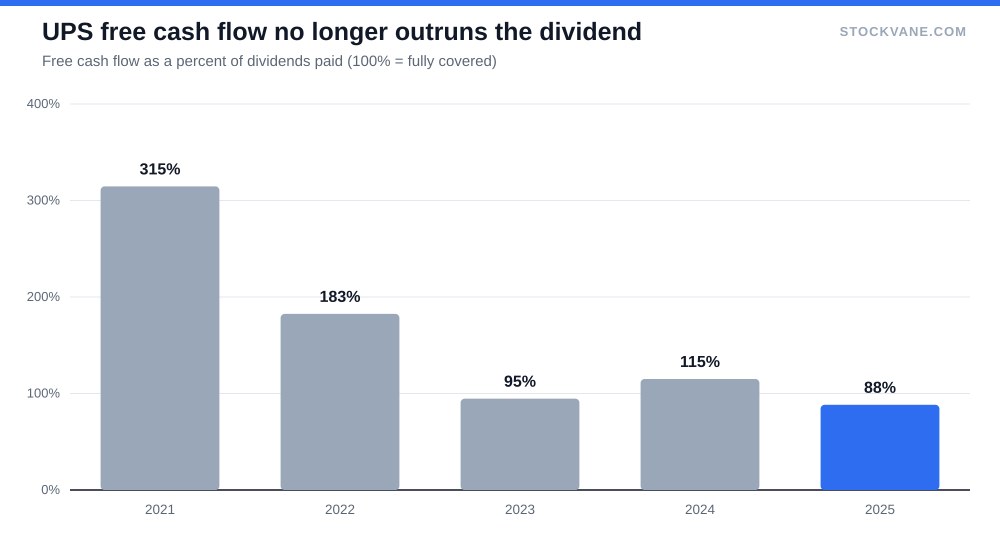
One good year of 115% in 2024 hides how thin this is. Coverage of exactly 100% means there is nothing left for debt paydown or a bad quarter. It only works while free cash flow holds up, and free cash flow depends on a business whose revenue fell from $100.3 billion in 2022 to $88.7 billion in 2025 and whose operating profit fell about 40% over the same stretch, from $13.1 billion to $7.9 billion.
Why earnings do not settle it either
The usual shortcut is the payout ratio, and here it looks tidy in the wrong way. The four latest quarterly payments of $1.64 add up to $6.56 a share. Diluted earnings per share for 2025 were also $6.56. On paper that is a payout of exactly 100%. The dollars agree: dividends paid were $5.4 billion against net income of $5.57 billion, about 97%.
There is a softer way to read it. UPS raised its full-year guidance in July to roughly $7.22 of adjusted earnings per share, and against that number the dividend is about 91%. The valuation tab shows a forward P/E of 12.7, which works out to about $7.79 a share of expected earnings over the next year. Those forward figures are adjusted numbers, and adjusted means the company has removed items it considers one-time. Some of those removals are fair. UPS has spent the past year and a half closing buildings and shrinking its Amazon business, and that cost is real but not permanent. Still, a dividend is paid in cash, not in adjusted earnings.
How the gap got funded
To see who paid for the difference, I went to the cash flow statement. In 2025 UPS had $4.8 billion of free cash flow. It paid $5.4 billion in dividends and spent about $0.8 billion on net share repurchases, so it needed roughly $1.5 billion more than the business made. Net borrowing was $2.1 billion, and total debt including lease obligations rose from about $25.7 billion to $28.6 billion. Cash and short-term investments ended the year near $5.9 billion, slightly lower than the year before.
None of that is alarming for a company this large. Borrowing to bridge a soft year is what balance sheets are for. It matters because the pattern cannot run for long. If the same gap repeats in 2026 and 2027, the dividend stops being a policy decision and becomes a financing decision. Our comparison of high yield against dividend growth makes the same point in general terms: a payout that is high because the price fell and not because the business grew deserves a harder look.
What changed in the latest quarter
The reason not to be gloomy is the last quarter. Revenue was $22.8 billion, up 8% from a year earlier, after three quarters of declines of 4%, 3% and 2%. It is the only quarter of growth in the last four. On its second-quarter call UPS said it had completed its Amazon volume reduction and the related network reconfiguration, and it raised its full-year revenue target to about $91.2 billion from $89.7 billion. The company’s own second-quarter release also says the restructuring produced about $1.2 billion of savings in the first half, on the way to a $3 billion target for the year.
The segment data shows how concentrated the bet is. U.S. Domestic Package brought in $14.9 billion of the quarter’s $22.8 billion, about 65%, and International Package added $5.0 billion, about 22%. So the dividend mostly depends on one domestic parcel network and on what each package earns.
If those savings show up in cash, the picture improves fast. An extra $1 billion of free cash flow would move 2025’s 88% coverage to about 107%. If that happens, I would not call the case for a cut strong. What I cannot tell you is how much of the savings is durable and how much simply offsets weaker pricing. Only two or three more quarters will show whether the savings reached the cash line.
The same test at FedEx
The cleanest comparison is the other big U.S. parcel company. FedEx’s fiscal year ends in May, so its latest full year is fiscal 2026. On the FedEx financials tab, free cash flow was $5.1 billion and dividends paid were $1.4 billion, so coverage was about 372%. The stock yields 1.9%, which is less than a third of UPS.
| UPS | FedEx (fiscal year ended May 2026) | |
|---|---|---|
| Dividend yield | 6.6% | 1.9% |
| Free cash flow, latest full year | $4.8B | $5.1B |
| Dividends paid, latest full year | $5.4B | $1.4B |
| Free cash flow as % of dividends | 88% | 372% |
| Trailing P/E | 18.4x | 16.4x |
That is the trade in one line. FedEx pays a small dividend that its cash flow covers almost four times over, and UPS pays a large one that its cash flow barely covers. The two companies are not identical, and a single year of free cash flow can be lumpy, so I would not lean on the exact multiple. But it shows that a high yield in this industry is a choice about how much of the cash to hand back, and that UPS has chosen to hand back nearly all of it.
What the analysts and the model see
Of the 18 analysts on the analyst consensus page, 50% rate the stock a buy, 39% a hold and 11% a sell. The average target of $117 is about 18% above the current price, and the lowest target of $76 is about 23% below it. A stock with 11% sell ratings is one the professionals disagree about, and they are disagreeing about exactly this question.
| Metric | Value | Context |
|---|---|---|
| Free cash flow, FY2025 | $4.8B | 88% of dividends paid |
| Price (approx.) | $99.06 | 52-week range $77 to $117 |
| P/E (TTM) | 18.4x | Five-year average 17.0x |
| Price-to-sales | 0.9x | Five-year average 1.3x |
| Analyst ratings | 50% buy, 39% hold | 18 analysts; average target $117 |
| Dividend yield | 6.62% |
The StockVane quant model has moved in the wrong direction. It graded the stock a C with a score of 68 on 09-14, and it is a D with a score of 52 on the rating history page as of 09-20. I would not read too much into a one-week move, since the model works from price action and valuation and not from the dividend. The shares are about 15% below their 52-week high of $117 and 29% above the low, which puts them in the middle of a wide range. At 18.4 times trailing earnings the stock is a little above its five-year average of 17.0, so the market is not offering a bargain multiple on top of the yield.
The reports have not helped
Recent earnings days have been rough for holders. Over the last five reports the stock moved -6.6%, -4.0%, +0.2%, +8.0% and -10.6%, an average swing of about 6% in either direction. The next report is due October 27. The stock fell 6.6% on the day of the most recent report, in a quarter when revenue grew 8%, so headline growth alone has not been enough to lift the shares.
What a safe payout would look like
I would call this dividend safe once free cash flow covers the payout by at least 110% for a full year, and once total debt stops rising while the payout stays where it is. Revenue also has to keep growing now that the Amazon reduction is behind it. Only that last condition has started, and it has started for one quarter.
That makes UPS a reasonable holding for someone who wants a 6.6% yield and can accept that the payout may stay flat for years, but not a stock I would buy for a growing income stream. If you own it, watch free cash flow in the third-quarter report before the yield. If you are looking to buy, waiting for that report should not cost you the next dividend, since UPS went ex-dividend on November 17 last year, and it shows whether the recovery reached the cash.
Financial disclaimer: The content on StockVane is for educational and informational purposes only and should not be construed as professional financial advice. Stock market investing involves risk of loss.