Here’s a scene I’ve watched play out too many times.
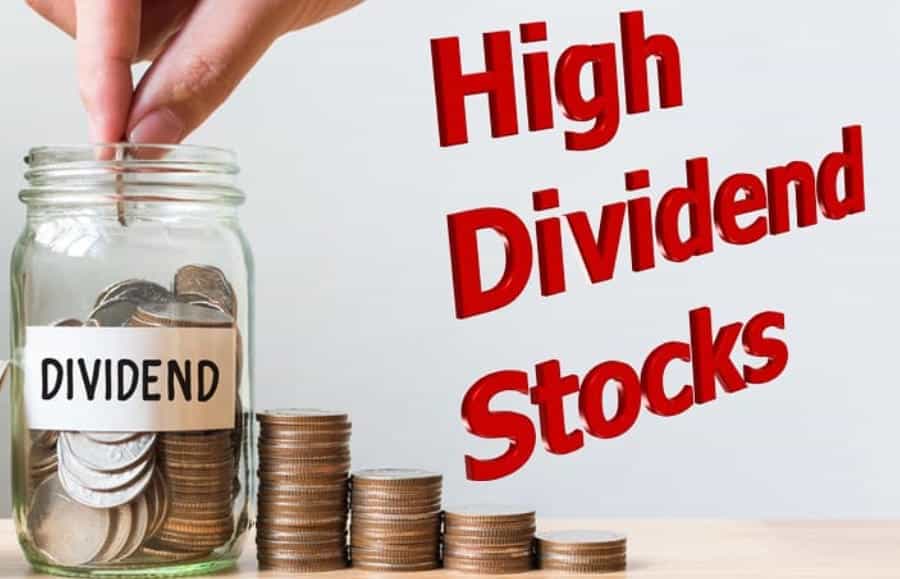
A new investor opens a brokerage account, discovers the dividend yield column, sorts it from highest to lowest, and immediately feels like they’ve found the cheat code. A stock yielding 9%. Another at 11%. One glorious outlier sitting at 14%. The math writes itself — $100,000 invested at 10% average yield generates $10,000 per year without touching the principal. Passive income. Financial freedom. The whole dream, apparently solved in about four minutes of research.
Then, six to eighteen months later, one of those companies cuts its dividend by half. The stock drops 35% on the announcement. The investor has lost $35,000 in principal to capture $5,000 in income they barely had time to reinvest. The yield that looked like a gift was actually the market’s very public, very loud warning that something was wrong — a warning written in the language of percentage points rather than English, which is why so many beginners miss it entirely.
This is the defining danger of dividend investing done without a framework. And it’s exactly why the choice between high-yield and dividend growth investing matters more than most introductory content acknowledges.
Why Dividend Yield Is the Most Misunderstood Number in Investing
Before comparing strategies, it’s worth being precise about what dividend yield actually measures — and what it doesn’t.
Yield is a ratio: annual dividend divided by current stock price. This seems straightforward until you realize that yield rises whenever the stock price falls, regardless of whether anything positive happened with the dividend itself. A company whose stock drops from $50 to $25 has doubled its yield without the management team having made a single decision about dividends. That doubled yield is not an opportunity. It’s a symptom.
The S&P 500’s average dividend yield in 2026 sits around 1.1% — near its historical floor. That number reflects two simultaneous realities: first, a decade of rising stock prices has mechanically compressed yields as prices outpaced dividend increases; second, the index’s largest and fastest-growing companies — cloud infrastructure providers, AI chip designers, enterprise software businesses — pay minimal dividends or none at all because they’re reinvesting every dollar of free cash flow into expansion that generates returns well above what dividends would.
Against this backdrop, the 10-year Treasury yield hovering near 4.4% creates a meaningful challenge for dividend investors. When the risk-free rate is 4.4%, a dividend stock yielding 3% needs to offer a credible capital appreciation argument to justify holding over a government bond. This is a harder case to make than it was five years ago, and it shapes everything about how to approach dividend strategy today.
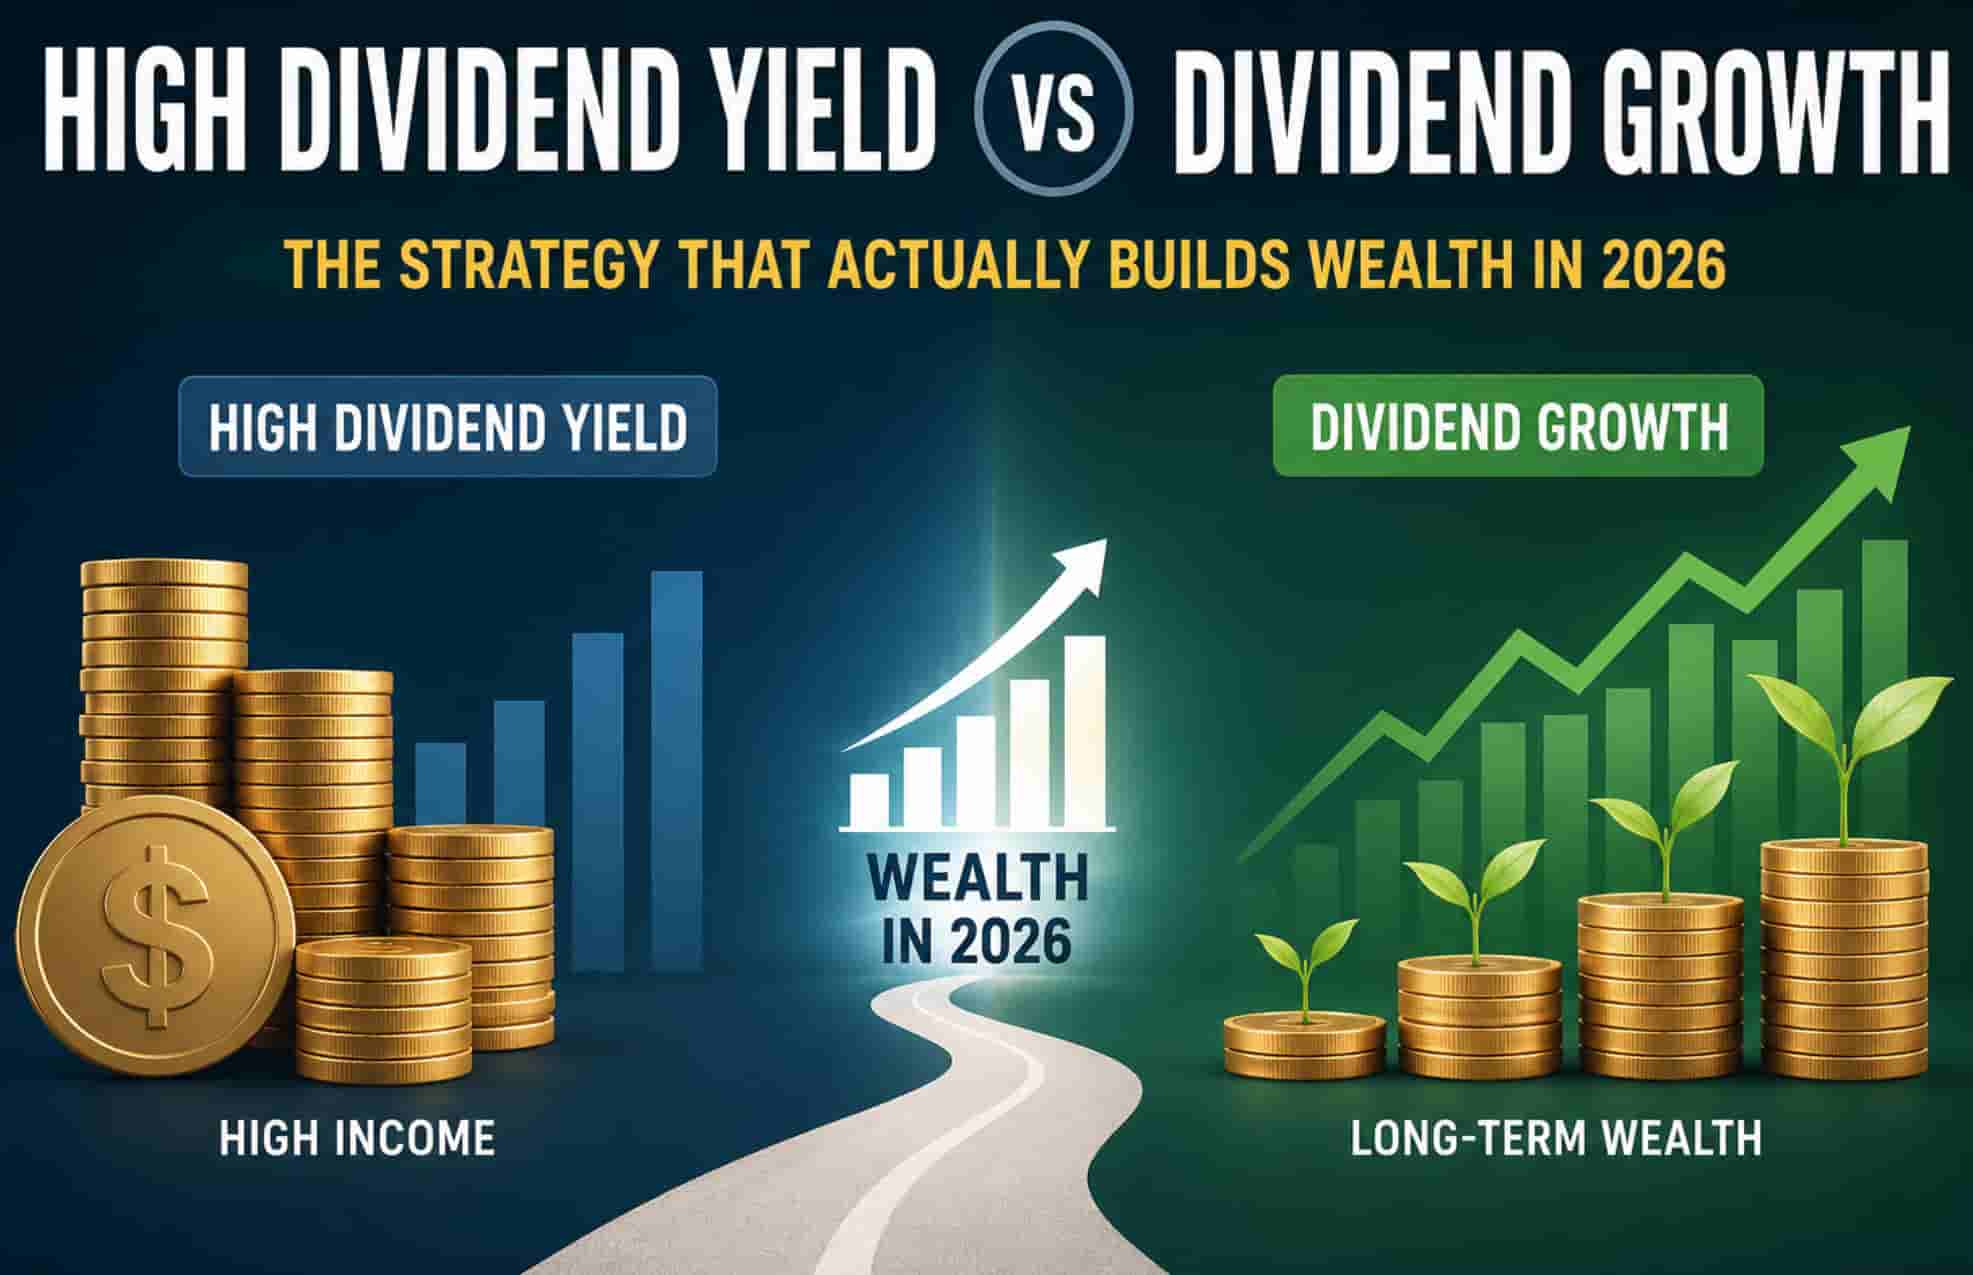
Strategy One: High Dividend Yield — The Income Now Approach
The case for prioritizing current yield is not wrong. It’s situational.
For investors who genuinely need income now — retirees drawing from portfolios, people building supplementary cash flow alongside employment income, or investors in a phase of life where capital appreciation is less urgent than stability — high current yield solves a real problem. The income arrives regardless of whether the stock price moves. Dividend checks don’t care about volatility.
The structural categories where high yields tend to be most defensible share a common characteristic: their income is contractually or legally mandated rather than discretionary.
Real estate investment trusts are legally required to distribute at least 90% of taxable income to shareholders. This constraint creates yields that are high by design rather than by distress. The best REIT operators — those owning essential retail locations, industrial warehouses, healthcare facilities, or infrastructure — generate rental income from long-term leases that provides exceptional cash flow visibility. A company collecting rent on 15,000 properties under 10-year leases has a fundamentally different income profile than a manufacturer whose quarterly revenue depends on economic conditions.
Midstream energy companies — the businesses that own pipelines, storage terminals, and processing facilities — operate similarly. They collect fees based on the volume of energy flowing through their infrastructure, not on the price of the energy itself. A pipeline operator earns approximately the same fee revenue whether natural gas is trading at $2 or $5. This toll-road-like business model supports dividends that hold through commodity price cycles in ways that pure energy producers cannot match.
The common thread: durable, contractual cash flow supporting the dividend. When that characteristic is present, high yield can be genuinely compelling. When it’s absent — when the yield is being paid out of declining earnings, accumulated debt, or asset sales — the high number is the problem, not the opportunity.
What separates a high-yield opportunity from a yield trap:
| Characteristic | Sustainable High Yield | Yield Trap |
|---|---|---|
| Free cash flow payout ratio | Below 75% | Above 90% or negative |
| Source of cash flow | Contractual, recurring | Cyclical, variable |
| Dividend growth history | 5+ years of consecutive increases | Flat or recently cut |
| Balance sheet leverage | Net debt-to-EBITDA below 3.5x | Above 4.5x or rising |
| Earnings trajectory | Stable or growing | Declining for multiple quarters |
| Yield vs sector peers | Modestly above average | Dramatically above average |
| Reason for high yield | Business generates excess cash | Stock price has fallen significantly |
The last row is the most important diagnostic. If a stock yields 8% because the business generates enormous free cash flow relative to its market value, that’s a potentially compelling opportunity. If it yields 8% because the stock price fell 45% while management hasn’t touched the dividend yet, the dividend is next. These look identical in a dividend yield screener. They are completely different situations.
Strategy Two: Dividend Growth — The Compounding Income Approach
Dividend growth investing requires accepting something psychologically uncomfortable: starting with less income than you could get elsewhere. A portfolio of high-quality, fast-dividend-growing companies might yield 2% initially — less than a money market fund, less than Treasuries, less than most high-yield alternatives. This feels wrong to income-oriented investors, and it’s why many of them never meaningfully engage with the strategy.
The intellectual case rests entirely on the math of compounding over long time periods.
A company paying a 2% dividend and growing that dividend at 12% annually will be paying a dividend equivalent to 6.2% of your original investment within ten years. At fifteen years, that cost-basis yield reaches 10.9%. At twenty years, 19.2%. These numbers assume no stock price appreciation whatsoever — only the dividend growth. In practice, earnings growth drives both dividend growth and stock price appreciation simultaneously, so the actual total return tends to be higher.
The companies capable of sustaining 10-12% annual dividend growth over a decade are not random. They share characteristics that are identifiable in advance: dominant market positions that generate pricing power, asset-light business models that convert revenue to free cash flow at high rates, management cultures that treat the dividend as a binding commitment rather than a discretionary distribution, and balance sheets conservative enough to maintain dividend growth through economic downturns.
Financial services companies with recurring fee structures, consumer staples businesses with brands that command pricing power regardless of economic conditions, healthcare companies with patent-protected drug portfolios, technology-adjacent businesses with long-term service contracts — these categories produce the most durable dividend growth records. Their common attribute is that revenue doesn’t collapse during recessions even when consumers are cutting discretionary spending.
The compounding demonstration:
| Starting Yield | Annual Dividend Growth Rate | Year 10 Cost-Basis Yield | Year 20 Cost-Basis Yield |
|---|---|---|---|
| 2.0% | 5% | 3.3% | 5.3% |
| 2.0% | 8% | 4.3% | 9.3% |
| 2.0% | 12% | 6.2% | 19.2% |
| 3.0% | 5% | 4.9% | 8.0% |
| 3.0% | 8% | 6.5% | 14.0% |
| 5.0% | 2% | 6.1% | 7.4% |
| 5.0% | 0% | 5.0% | 5.0% |
Look at the bottom two rows carefully. The 5% yielder that grows its dividend at 2% per year ends up at 7.4% cost-basis yield after twenty years. The 2% yielder growing at 12% ends up at 19.2%. Over long enough time horizons, growth rate dominates starting yield almost completely.
This is why experienced dividend investors who’ve been compounding for two or three decades talk about their “yield on cost” rather than current yield. An investor who bought a quality dividend grower fifteen years ago at a 2% yield and held through three dividend doublings is now receiving an income stream that represents 16% of their original investment per year — a number that looks nothing like the current market yield on the stock.
The Dividend Aristocrats: What Consistency Actually Delivers
The S&P 500 Dividend Aristocrats index includes companies with at least 25 consecutive years of dividend increases. This is a demanding criterion. Most public companies have never achieved it. The ones that have represent a self-selected sample of exceptional business quality — not because the criterion filters for it explicitly, but because only businesses with durable competitive advantages, conservative financial management, and reliable earnings streams can keep increasing dividends through recessions, industry disruptions, and management transitions over a 25-year span.
The performance record of this group relative to the broader market tells a specific story. Dividend Aristocrats have historically delivered returns competitive with the S&P 500 while exhibiting meaningfully lower volatility — roughly 10-15% less by standard deviation measures. More significantly, during major market drawdowns their portfolios have typically declined less severely than the broader index.
This matters more than most investors initially appreciate. Portfolio behavior during drawdowns determines actual realized returns for real investors in a way that annualized return calculations don’t capture. When a portfolio drops 34% during a crisis, the investor who needs to withdraw funds at that moment crystallizes a permanent loss. When a dividend-focused portfolio drops only 26% through the same period, the withdrawal at the trough is less destructive to long-term outcomes. For investors in or approaching distribution phase — where they’re withdrawing rather than accumulating — this behavioral characteristic of dividend-growth portfolios is arguably their most important feature.
A Framework for Choosing Between the Strategies
The honest answer to “which is better” is that it depends on precisely the factors most investors don’t think about carefully when they start.
Investment horizon is the most important variable. Over five to seven years, high current yield wins the income comparison almost every time. A 5% yielder generates 25-35% in cumulative dividends over that period, while a 2% grower at 10% annual growth generates roughly 12% in cumulative dividends. Short time horizons favor current income. Long time horizons favor growth rate.
Income timing requirements are the second most important. An investor who genuinely needs the income — to live on, to supplement other income, to fund a specific goal — should not sacrifice current yield for theoretical future yield. Theoretical future yield doesn’t pay this month’s expenses. An investor who doesn’t need current income and is reinvesting dividends should optimize for growth rate rather than starting yield.
Risk capacity matters in ways people underestimate. High-yield portfolios require more active monitoring. A company’s ability to sustain a 6% yield needs to be verified against current financial statements regularly — the dividend that was safe twelve months ago may not be safe today if earnings have deteriorated. Dividend growth portfolios of the Aristocrat variety can often be held with less frequent reassessment, because the 25-year track record implies a business quality that doesn’t usually deteriorate silently.
Tax situation shapes the after-tax comparison. Both qualified dividends and capital gains in the US receive preferential tax treatment compared to ordinary income. But within dividend investing specifically, high-yield strategies in taxable accounts produce more current taxable income than dividend-growth strategies that have most of their return in unrealized appreciation. For investors in high marginal tax brackets, a dollar of capital appreciation may be worth meaningfully more than a dollar of current dividend income after taxes.
The Hybrid Approach: Practical Portfolio Construction
Most investors who spend enough time with both strategies eventually converge on a hybrid approach — not because they can’t decide, but because the two strategies complement each other in specific ways.
Core dividend growth holdings provide the compounding engine: positions in businesses with pricing power, growing dividends, and total return potential that exceeds the risk-free rate by a comfortable margin. These require patient holding through valuation volatility.
A meaningful allocation to quality high-yield — REITs, midstream infrastructure, established healthcare payers — provides current income that can be reinvested into more shares during market weakness, creating a natural dollar-cost averaging mechanism without requiring ongoing capital contributions. When markets fall and these yields spike temporarily, the reinvested income buys more shares at depressed prices, accelerating long-term compounding without additional emotional decision-making.
The specific weight between these two categories should shift with life stage. An investor twenty-five years from needing distributions should weight heavily toward dividend growth. An investor five years from significant withdrawals should weight toward current yield to reduce dependence on stock price appreciation that may or may not materialize on schedule.
Three Numbers That Tell You Almost Everything About a Dividend
Regardless of which strategy a stock belongs to, three metrics should sit at the top of any dividend evaluation.
Free cash flow payout ratio — the dividend payment divided by free cash flow, not reported earnings. Earnings can be influenced by non-cash accounting items. Free cash flow is the actual cash that arrived in the business during the period. If free cash flow is consistently below the dividend payment, the company is funding shareholder distributions by borrowing or selling assets. That is not a dividend. It is a liquidation disguised as income.
Dividend growth streak — consecutive years of dividend increases. This number is a proxy for business durability. Companies that sustained and grew their dividends through 2008-2009, 2015-2016, 2020, and 2022 have demonstrated their commitments under adversarial conditions. A two-year streak proves nothing about what happens when conditions deteriorate.
Net leverage — debt relative to earnings before interest, taxes, depreciation, and amortization. Dividend payments are subordinate to debt service obligations. A company with four or five times leverage has a meaningful portion of its cash flow committed to bondholders before equity investors see a cent. That leverage creates fragility that doesn’t show up in current payout ratios but appears with speed when earnings decline.
What I’d Do With New Money in This Environment
In a world where the risk-free rate sits near 4.4%, I want dividend stocks to clear a hurdle before I buy them. That hurdle has two components.
The first is a projected five-year total return — dividends plus anticipated price appreciation — that comfortably exceeds the Treasury yield by at least 3 percentage points. Below that margin, the equity risk premium isn’t being compensated adequately. This criteria eliminates a substantial portion of the high-yield universe where yield is attractive but total return is not, because either the business is declining or the valuation is stretched for the wrong reasons.
The second is dividend sustainability confidence. I want to be able to look at the free cash flow statement, the balance sheet, and the competitive dynamics of the business and conclude that the dividend is highly likely to be at least as large in three years as it is today. Not guaranteed — nothing in markets is guaranteed — but probable enough that I’m not making a bet on business recovery disguised as an income purchase.
By those criteria, the current environment rewards selectivity over yield-chasing. The most attractive opportunities tend to cluster in businesses with essential services, infrastructure characteristics, or recurring revenue models — categories where cash flow visibility is high regardless of economic conditions.
What they are not: the most exciting names, the fastest-growing companies, or the stories getting the most coverage. The best dividend investments have always been boring. The boringness is not a bug. It is precisely the feature that makes them work.
This article reflects the author’s independent analysis and personal investment perspective. Nothing in this article constitutes financial advice or a recommendation to buy or sell any specific security. All investors should conduct their own research and consult a qualified financial advisor before making investment decisions.