
The vote was 12 to 0. Every member of the Federal Open Market Committee backed raising the federal funds rate on September 16, from 3.50%-3.75% to 3.75%-4.00%, the first increase since 2023. The S&P 500 finished that day down 0.45% at 7,551.81, a modest reaction to the first hike in three years.
I titled this piece around the idea that the Fed is stuck, and the word aged less well than I expected. For five straight meetings the committee sat on the same rate because it could not cut into inflation above 3% and did not want to hike into a slowing economy. Now it has hiked, and it is still stuck. The problem underneath has not changed: prices are being pushed higher by oil and other supply forces that a quarter-point move cannot fix. My view is that stock investors are still treating this as a pause on the way back to easier money, when the more useful assumption is that the rate they see today is where they will be living for a while.
How a stalemate turned into a hike
The path is short. The Fed held at 3.50%-3.75% at every meeting from the winter through July. At the April 29 meeting, the last under Jerome Powell as chair, it held on an 8-4 vote, and four dissents on a hold is not what a comfortable committee looks like. Powell’s last day as chair was May 15, and the Senate confirmed Kevin Warsh by a 54-45 vote, the narrowest margin since the current confirmation process began. Warsh took office on May 22.
Meanwhile core PCE inflation, the Fed’s preferred gauge, rose from 3.0% in December to 3.3% in July, according to Chase’s summary of the September meeting. Oil had jumped after the Middle East conflict that began in late February and went back above $100 a barrel in the spring. Brent has been in the $90s in recent weeks. The 10-year Treasury yield touched about 4.8% in early September, its highest level since early 2025.
Warsh’s press conference was brief and gave little forward guidance, and the committee’s projections point to one more quarter-point increase before the end of the year. He said the summer’s inflation readings had not convinced him that underlying trends were improving. That is the sentence the market sold on.
The committee’s projections also put the policy rate in the low 4% range in 2027, according to one summary of the September dot plot, which is a long way from the cuts many portfolios were built to expect. For a stock bought on the assumption of a rate near 3%, that is a different discount rate applied to every future dollar of earnings, and it is the reason I think the adjustment is not finished.
Why a hike does not fix an oil problem
A rate increase works by cooling demand. It makes borrowing more expensive, slows spending and eventually lowers the price pressure that comes from a hot economy. It does very little about the price of a barrel of crude that is set by a supply disruption thousands of miles away, and it does nothing about a shipping cost that rose for the same reason.
That is the awkward part. Oil reaches freight and factory inputs first and consumer prices later, and the pass-through is slower than most forecasts assume. I do not know how much of the 3.3% core reading is oil pass-through and how much is broader demand, and I do not think the Fed knows either. The committee’s own updated projections raised growth and inflation and lowered unemployment, which suggests it sees an economy that is still running warm. If that is right, it will hike again. If the economy is weaker than the projections imply, the hike lands on a soft spot.
Either way, the equity risk is on the same side. Higher rates for longer put pressure on valuations, and the S&P 500 valuation analysis we published earlier this year explains why the index has little cushion when the discount rate moves. The index is only about 2% below its 52-week high, according to SPY, which is a small drawdown for a market that just absorbed a rate hike and a Treasury yield near 4.8%.
What the price data says about rate-sensitive stocks
The textbook says utilities and property owners suffer first when yields rise, along with growth stocks priced on distant earnings. The price data is close to the textbook, with one exception.
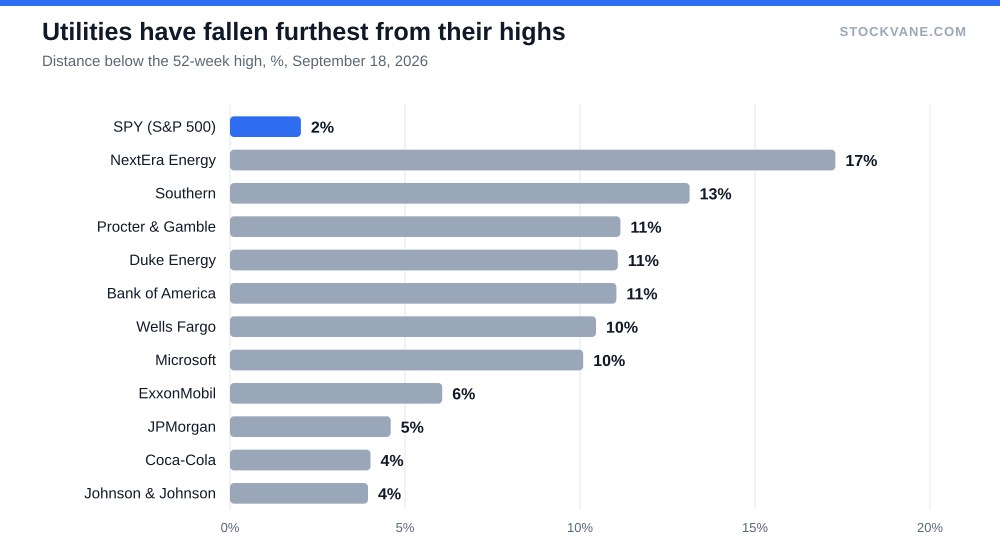
Utilities are the clearest case. NextEra Energy sits about 17% below its 52-week high, Duke Energy about 11% and Southern about 13%, an average near 14%, against 2% for the broad market. These are bond substitutes, and when the 10-year yield is near 4.8% a 3% dividend yield has to compete with a Treasury that pays more and carries no equity risk. Our data does not tie those drops to a single cause, so I am describing a pattern rather than assigning blame.
| Group | Company | Trailing P/E | Dividend yield | From 52-week high | Quant grade (score) |
|---|---|---|---|---|---|
| Banks | JPMorgan (JPM) | 15.0x | 1.7% | -5% | C (42) |
| Banks | Bank of America (BAC) | 13.3x | 1.9% | -11% | C (43) |
| Banks | Wells Fargo (WFC) | 12.5x | 2.1% | -10% | D (34) |
| Utilities | NextEra Energy (NEE) | 18.1x | 3.0% | -17% | D (46) |
| Utilities | Duke Energy (DUK) | 17.6x | 3.6% | -11% | D (30) |
| Utilities | Southern (SO) | 20.6x | 3.5% | -13% | D (25) |
| Staples | Procter & Gamble (PG) | 22.1x | 2.9% | -11% | D (23) |
| Staples | Coca-Cola (KO) | 26.5x | 2.4% | -4% | C (62) |
| Technology | Microsoft (MSFT) | 27.5x | 0.7% | -10% | D (27) |
| Energy | ExxonMobil (XOM) | 21.0x | 2.5% | -6% | B (73) |
| Health care | Johnson & Johnson (JNJ) | 31.3x | 1.9% | -4% | B (80) |
The twist is the banks. The common assumption is that a higher rate environment helps them. JPMorgan is only about 5% below its high, but Bank of America is about 11% below and Wells Fargo about 10% below, and large bank stocks had their worst day since February on the day of the hike, on fears that more increases would follow. Banks like a steeper curve and higher lending rates. They do not like a Fed that raises rates into slower loan growth and worse credit. The market has clearly not decided which of those forces wins.
Look at the other end of the table. ExxonMobil is up about 52% from its 52-week low and only 6% below its high, and Johnson & Johnson is about 4% below its high. Energy is paid by the same oil move that is hurting everyone else, and health care earns money that does not depend on rates. Those are the two spots where the market has been willing to pay.
Two groups I left out of the table need a mention. Property owners are a bad fit for a P/E column, but the price data is clear: Prologis sits about 11% below its high and American Tower about 10% below, and both carry a D grade from the quant model. Consumer staples split down the middle. Procter & Gamble is about 11% below its high with a yield near 2.9%, while Coca-Cola is only 4% below. Both are defensive, and yet the market treats one as a bond substitute and the other as a business it still wants to own. That kind of gap is a reminder that the rate story explains part of the picture and not all of it.
Where I would look for cushion
In a market where the Fed has to keep rates high and nobody knows for how long, businesses that earn real cash today are easier to hold than businesses that promise a lot later. That points toward companies with visible earnings and modest multiples, and toward watching where money is moving between sectors, which I cover in this guide. JPMorgan trades at about 15 times trailing earnings and NextEra at about 18, so neither is expensive, but they are priced very differently by the market right now.
What I would avoid is assuming that the last few years’ winners will keep working. Microsoft is about 10% below its high even after a 42% rise from its low. A stock priced on earnings that are still to come is the kind of holding that takes the hit when the discount rate rises, and a multiple in the high 20s leaves little room. I am not arguing against owning growth. I am arguing for sizing it as a bet on lower rates, and I do not expect lower rates this year.
Fewer clues from the Fed
Warsh’s first press conference as chair to follow a hike gave little forward guidance. When a chair says less, every sentence gets read closely and the market trades the tone as much as the content. On September 16 the S&P 500 lost less than half a percent for the day, but it turned lower while Warsh was speaking, after the statement itself had been digested.
I would keep positions smaller going into each meeting and treat any single reading of the Fed’s intent with suspicion. Selling everything is a different decision, and nothing in the price data calls for it.
What it would take to change my view
I will change my view if two things happen: core inflation falls below 3% for a few months without another oil spike, and the committee’s projections stop showing more hikes. Until then I would assume the 3.75%-4.00% range is the floor, not the ceiling, and that the market’s habit of pricing cuts in the following year is more hope than evidence.
The trade-off for a stock portfolio is plain. You can own the businesses that are being repriced for a higher rate and wait for them to recover, or you can own the ones that do not need the rate to come down. I lean toward the second group until the numbers say otherwise. Being early to a recovery in utilities costs a few quarters of patience. Being wrong about another hike costs more than that.
Financial disclaimer: The content on StockVane is for educational and informational purposes only and should not be construed as professional financial advice. Stock market investing involves risk of loss.
Sources: Dividends (SEC Investor.gov glossary) (https://www.investor.gov/introduction-investing/investing-basics/glossary/dividend) · Dividends tax topic (IRS) (https://www.irs.gov/taxtopics/tc404)