
Each dollar of revenue HPE booked in fiscal 2025 left about 0.17 cents of profit. That is one-sixth of a penny, on $34.3 billion of sales, in the year the Juniper acquisition closed and revenue rose 14%.
The stock did not seem to mind. It closed at $60.76, only 4.9% under its 52-week high of $64 and 210% above its low of $20. Buyers are looking through the 2025 income statement. My view is that they are right to look through part of it and wrong to look through all of it, because the case for HPE now rests on two numbers the company has not yet delivered: a full year of Juniper’s networking sales in the base, and an operating margin that climbs back from 4.8%.
This note lays out what the fiscal 2025 accounts show, what the three reported quarters of fiscal 2026 have changed, and where the math still has to be proved.
The year revenue rose and profit did not
Revenue climbed from $28.50 billion in fiscal 2022 to $29.14 billion, then $30.13 billion, then $34.3 billion in fiscal 2025. Growth for the three years before the deal ran 2% to 3% a year. Then it jumped 14%.
Profit went the other way.
| Metric | Value | Context |
|---|---|---|
| Price (approx.) | $60.76 | 52-week range $20 to $64 |
| P/E (TTM) | 31.3x | Five-year average -16.1x |
| Price-to-sales | 1.9x | Five-year average 0.8x |
| Analyst ratings | 59% buy, 41% hold | 17 analysts; average target $70 |
| Dividend yield | 0.92% |
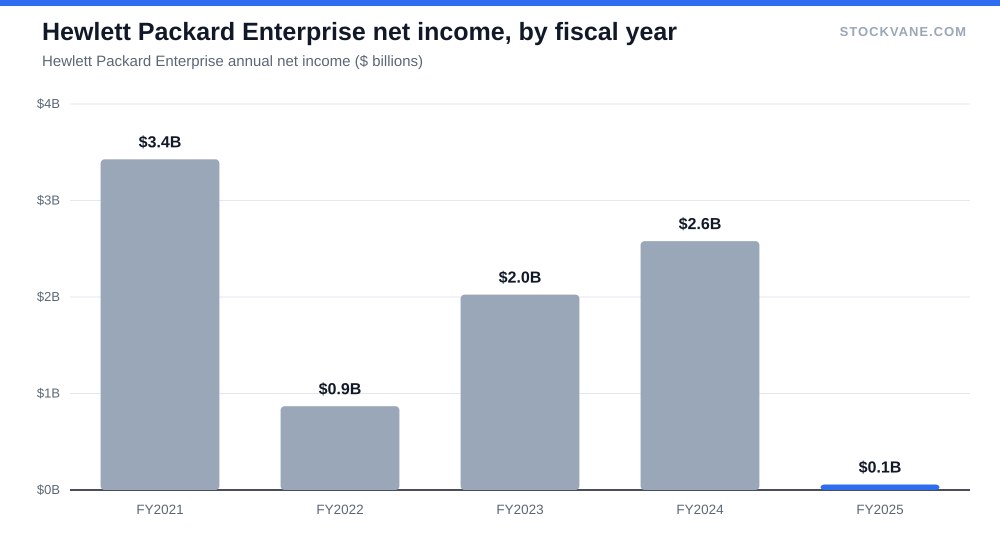
Operating income fell from $2.49 billion to $1.64 billion, a 34% drop, while sales grew. Gross margin narrowed from 32.8% to 30.3%, a decline of about 253 basis points. Net income fell from $2.58 billion to roughly $57 million, and diluted EPS ended at -$0.04. I read the margin squeeze as the price of absorbing a large acquisition: integration costs and a product mix that carries lower gross margin than the legacy business. The database does not itemize those charges, so I cannot tell you how much of the drop is one-time. That gap in the disclosure is why the second half of this note matters.
Fiscal 2026 has done most of the work already
The three reported quarters of fiscal 2026 brought revenue of $9.30 billion, $10.68 billion and $12.2 billion. Added together, that is $32.19 billion, 94% of all of fiscal 2025’s sales, with a quarter still to report. The latest quarter alone was 34% above the same quarter a year earlier and 14% above the previous one.
If the fourth quarter merely matches the third, fiscal 2026 revenue would be about $44.4 billion, 29% more than fiscal 2025. This is my arithmetic and not a company forecast. It shows that the step up is a change of scale, not a rounding effect.
The segments show where it comes from. In the third fiscal quarter, Cloud and AI produced $9.04 billion, or 74% of segment sales, and Networking produced $2.89 billion, or 24%. Networking is the Juniper business the deal was meant to buy. A quarter of revenue is a large share for one division, and it is the reason the company’s mix is changing. It is also why the AI story and the acquisition story cannot be separated. A reader who wants to see how the market treats another company whose backlog has to be turned into results can compare Oracle’s backlog case, which asks the same “prove it” question of a very different business.
The valuation depends on which EPS you use
On trailing earnings the P/E is 31.3, against a five-year average of -16.1. That average is negative because the company lost money in fiscal 2020 (-$0.32 billion) and earned almost nothing in fiscal 2025, so the comparison is close to meaningless. I would ignore it.
The forward figure is more useful. Analysts expect EPS of $3.99, which puts the stock at 15.2 times forward earnings (15.2 on the price shown). That is half the trailing multiple, and it depends entirely on EPS rising 106% from the trailing $1.94. Price to sales sits at 1.9 against a five-year average of 0.8, and price to book at 3.0 against 1.2. Both are at the top of their historical bands. The market cap is $80.7 billion.
So the stock is not cheap on its own history. It is cheap only if the forward EPS arrives. If EPS lands at $3.00 rather than $3.99, the same price is 20.3 times earnings, which is no bargain for a hardware and networking business whose gross margin is 30.3%.
Set the two multiples side by side and the debate becomes one about a single input. At 31.3 times trailing EPS of $1.94, the market is paying a premium price for a company that just posted a loss per share on a fiscal-year basis. At 15.2 times forward EPS it is paying a moderate one. The whole difference between those readings is whether the forward estimate is right, and the estimate is the analysts’ figure, not the company’s promise.
That is also why the fiscal 2024 comparison matters. In that year the company earned $1.93 a share on $30.13 billion of revenue and an operating margin near 8%. If the enlarged company gets back to even that margin on $44.4 billion of sales, operating income would be about $3.7 billion, well above the $1.64 billion of fiscal 2025, using the database’s 8.28% EBIT margin for fiscal 2024. That is the arithmetic behind the bullish case, and it needs no heroic assumptions, only a return to a margin the business earned two years ago.
What the analysts and the tape say
Of 17 analysts, 59% rate the stock a buy and the rest hold; none sell. The average target is $70, 15% above the price, in a range of $54 to $88. The lowest target is below the current price, so at least one analyst thinks the run has gone too far.
Earnings days have been kind to shareholders lately. The September 2 report moved the stock +5.0%, and the June 1 report moved it 19.5%, against an average absolute move of 7.4%. The March report, though, was down 3.3%, so the pattern is favorable but not one-directional. Short interest is 4.2% of the float, and the Quant score has moved from C to B in the last few weeks. I treat both as sentiment gauges and not as evidence about the business.
The dividend is small. HPE raised its quarterly payment from $0.13 to $0.1425, a 9.6% increase, and the trailing amount of $0.56 gives a yield of 0.92%. Nobody buys this stock for income. The payment is worth mentioning only because it stayed in place while profit fell to almost nothing, which suggests the board does not think the 2025 result reflects the earning power of the business.
Why the timing of the margin matters
Margins do not recover on a schedule. When a company absorbs a large acquisition, the cost side usually arrives first and the savings later, which is why the fiscal 2025 income statement looks the way it does. The reverse also holds: if integration is going well, a single quarter can show operating income jumping by more than revenue does. That margin expansion is what the bulls are waiting for, and it is the reason the latest report drew a +5.0% response and the June report a much larger one. I do not treat either reaction as proof. A stock that has tripled from its low has already paid for some of the recovery.
The counter-case
The strongest argument against the stock is the one in the table. Operating income has fallen while revenue has risen, and the gross margin is falling as the mix shifts. If the fiscal 2026 quarters bring more revenue at margins that stay near 30.3% or lower, a larger company can be less profitable than a smaller one, and a 15 times forward multiple would be paying for growth that does not reach the earnings line.
There is also the question of what the growth is made of. Part of the fiscal 2026 revenue increase is the Juniper business simply being counted, which is not organic growth. For that reason, comparing the 34% quarterly rise with peers that grew without buying anyone would flatter HPE. I would want to see organic figures before drawing a conclusion, and the database does not provide them.
I am not covering the debt taken on for the deal, because I do not have balance sheet figures I trust for this note. That is a real omission for an acquirer, and a reader who wants the full picture should check the financials page before sizing a position. The demand backdrop for AI infrastructure is also not in scope here; for one view of what limits it, see the piece on power as the bottleneck.
What fiscal 2026 has to print
The test is the fourth-quarter report, due after the fiscal year closes. Three numbers matter. Revenue should come in at or above the $12.2 billion of the latest quarter, which would confirm the 29% year of growth. Gross margin should stop sliding: a reading at or above 30% would say the mix is stabilizing. And full-year EPS has to be clearly positive; a figure above $2.00 would show that fiscal 2025 was a one-time trough. If margin drops below 29% while sales rise again, I would stop calling the deal a success and start calling it a purchase of revenue.
Financial disclaimer: The content on StockVane is for educational and informational purposes only and should not be construed as professional financial advice. Stock market investing involves risk of loss.
Sources: Dividends (SEC Investor.gov glossary) (https://www.investor.gov/introduction-investing/investing-basics/glossary/dividend) · Dividends tax topic (IRS) (https://www.irs.gov/taxtopics/tc404)