
Put $300,000 into the 300 largest stocks in StockVane’s coverage, and there are two obvious ways to split it. One hands every name $1,000. The other sizes each position by market value, and under that rule NVIDIA alone gets about $19,600, a 6.5% slice, roughly 20 times what it gets in the first version.
Those two portfolios hold the same companies. They are still different bets, and over the past twelve months they paid out very differently on paper. This post measures the gap, explains where it comes from, and says who should care.
One scope note first. StockVane covers 300 large stocks, not the 500 in the S&P 500, and it does not carry an equal-weight S&P 500 fund. So the comparison below is between the two weighting rules applied to our own list of 300, which is the same logic those two index products use. SPY closed at $761.69 on September 18, 2.0% under its 52-week high of $777.44 and 22% above its low. Where I quote a share or a return, it belongs to the 300-stock list and not to the fund.
My thesis: equal weighting is a bet on breadth, and the last twelve months rewarded breadth mainly through a handful of extreme winners, so the headline gap between the two versions overstates what a typical stock delivered.
How concentrated the cap-weighted version is
The ten biggest listings, led by NVIDIA, Apple and the two classes of Alphabet, add up to 39.6% of the list’s total market value. The smallest hundred stocks add up to 8.6%. Ten names outweigh a hundred by more than four to one.
Under equal weighting, the same ten would carry 3.3% of the money.
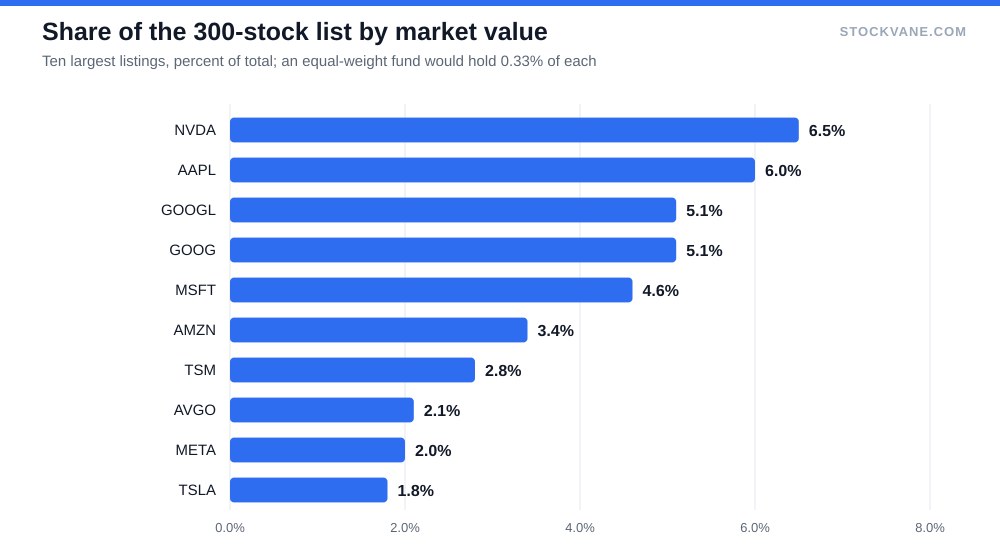
Two small caveats. Alphabet has two share classes and both sit in the top ten, so it is nine companies wearing ten tickers (our piece on why Alphabet is the cheapest big tech stock covers that valuation case). And Taiwan Semiconductor, at number seven, is a foreign listing that the S&P 500 would not hold at all, which is part of why I keep calling this a 300-stock list and not the index.
The size gap between the top and bottom of the list is also large. The biggest company is about 93 times the market value of the smallest. In a cap-weighted fund, that ratio is the ratio of influence. In an equal-weight fund it is one to one.
| Stock | Market value | Share of list | Equal-weight share | 12-month price change |
|---|---|---|---|---|
| NVIDIA (NVDA) | $5,261B | 6.5% | 0.33% | 26% |
| Apple (AAPL) | $4,849B | 6.0% | 0.33% | 37% |
| Alphabet-A (GOOGL) | $4,140B | 5.1% | 0.33% | 38% |
| Alphabet-C (GOOG) | $4,103B | 5.1% | 0.33% | 35% |
| Microsoft (MSFT) | $3,680B | 4.6% | 0.33% | -4% |
| Amazon (AMZN) | $2,770B | 3.4% | 0.33% | 10% |
| Taiwan Semiconductor (TSM) | $2,247B | 2.8% | 0.33% | 65% |
| Broadcom (AVGO) | $1,728B | 2.1% | 0.33% | 4% |
| Meta Platforms (META) | $1,651B | 2.0% | 0.33% | -14% |
| Tesla (TSLA) | $1,443B | 1.8% | 0.33% | -15% |
What the past twelve months paid
From September 19, 2025 to September 18, 2026, a cap-weighted basket of the 300 stocks returned 20.3% in price terms. The equal-weighted basket returned 41.0%. That is a twenty-point gap in favor of equal weighting, and it would make a tidy argument if it stopped there.
It does not stop there. The ten largest listings averaged a 18.3% gain, while the other 290 averaged 41.8%. Owning the giants in proportion to their size was a good bet, since they are big enough to carry the total. They just were not the best-performing part of the market.
Now look at what sits inside that 41.0%. The median stock rose 22.3%, barely ahead of the cap-weighted number. Sandisk climbed 1,653%, Micron 525% and Moderna 510%. Take Sandisk out and the equal-weight average falls to 35.6%. 25 stocks more than doubled and 89 finished lower, with Boston Scientific the weakest at -56%.
I read this as a fat right tail doing the work. An equal-weight fund holds each of those doublers, but only a sliver of each one, and the sliver shrinks further if the fund trims winners at every rebalance. My equal-weight figure is buy-and-hold with no trimming, so a rebalanced fund would very likely have done less well. That is the direction of the error, and I cannot size it from the data I have.
Counting stocks tells the same story from another angle. 154 of the 300 beat the cap-weighted return of 20.3%, which is 51%. Only 88 beat the equal-weight average, which is 29%. The first count sits at a coin flip. The second does not, and that is the signature of an average pulled up by a small group.
The last six months tell a different story
Shorten the window to March 31 through September 18 and the gap vanishes. That is the check I would run on any weighting claim: move the start date by six months and see whether the answer survives. Here it does not survive, which is a warning about how much one starting date decides.
| Window | Cap-weighted, 300 stocks | Equal-weighted, 300 stocks | Median stock | Top 10 average | Other 290 average |
|---|---|---|---|---|---|
| Sep 19, 2025 to Sep 18, 2026 | 20.3% | 41.0% | 22.3% | 18.3% | 41.8% |
| Mar 31, 2026 to Sep 18, 2026 | 18.9% | 19.0% | 8.9% | 21.7% | 18.9% |
Over those six months, the cap-weighted basket returned 18.9% and the equal-weight basket 19.0%. They tie to a tenth of a point. The ten largest listings averaged 21.7%, ahead of the 18.9% for the rest. The median stock returned only 8.9%.
That reversal matters for anyone reading a one-year comparison as a verdict. A weighting rule has no edge of its own. It is a way of loading up on whatever is currently working in the top of the index or in the tail below it, and which of the two is working changes.
Where the twelve-month gap came from
Most of the top ten sit close to the artificial-intelligence build-out, which is a debate of its own; we argued in the real AI bottleneck is power, not chips where the constraint may sit. I make no claim here about why the giants moved.
Take the top ten’s contribution to the cap-weighted return: 7.7 points of the 20.3%, or 38%. Ten stocks supplied close to two-fifths of the gain because they carry two-fifths of the weight. A fund built this way is already a concentrated position in a few technology and internet names, whatever the number of holdings on the fact sheet.
Some of those names had strong stretches inside the year. NVIDIA rose 26%, Apple 37% and the two Alphabet classes 38% and 35%. Others struggled, with Microsoft at -4%, Meta at -14% and Tesla at -15%. Cap weighting gave you all of them at size, and the average of 18.3% hides that spread.
The counter-case for staying cap-weighted
The plainest argument for the standard fund is that it costs nothing to maintain. There is no rebalancing, so there is no selling of winners and no trading friction, and the holdings drift toward whatever the market values most. Six months of data on this list say the largest stocks can catch up quickly when leadership swings back to them.
There is also a point about who the marginal buyer is. When 39.6% of the value sits in ten listings, a portfolio matching the index is structurally short of everything else. If you already own a technology-heavy 401(k) or a growth fund, a cap-weighted index fund on top adds to that concentration instead of diluting it.
The case against holding only cap-weighted is the reverse. If the giants stumble, the index falls with them, and the 290 others would have to rise to cover it. In the past year the other 290 did rise more, on average. I would not project that forward.
One more limit: price paid matters, and cap weighting is blind to it. A fund following market value buys more of a stock exactly as it gets more expensive. Our look at Walmart trading like a software company is one example of a large name whose multiple is part of the debate. Equal weighting trims that exposure to a fixed slice, but it also does not check what any of the 300 costs, so neither rule is a valuation view.
What I am not covering
I am not covering fees, taxes or the tracking gap of any specific fund, because StockVane has no data on an equal-weight S&P 500 product and I will not guess at it. Dividends are left out of every return above. The starting weights are backed out from current market values and price moves, which ignores share issuance and buybacks, so they are close but not exact. Numbers here describe a list of 300, not an index, and they are one twelve-month window that is very sensitive to a few extreme names.
The gap I would look for at the next rebalance
If you already own SPY, I would not swap it for an equal-weight fund because of a twenty-point one-year gap that a handful of doublers largely explain. I would ask a narrower question: what share of my money sits in the ten biggest names, and am I comfortable with it being about 40%? If not, a partial shift makes sense, sized so the giants still hold a plurality of the portfolio.
The number I would track is the six-month gap on this list. It was 0.1 points on September 18. A second consecutive stretch where the equal-weight basket lags the cap-weighted one by more than five points would tell me leadership is narrowing again, and that owning the 290 has become a bet against the market’s own momentum.
Financial disclaimer: The content on StockVane is for educational and informational purposes only and should not be construed as professional financial advice. Stock market investing involves risk of loss.
Sources: Dividends (SEC Investor.gov glossary) (https://www.investor.gov/introduction-investing/investing-basics/glossary/dividend) · Dividends tax topic (IRS) (https://www.irs.gov/taxtopics/tc404)