
In 2015, Kinder Morgan paid out $4.22 billion in dividends and generated $1.42 billion of free cash flow. In 2025 it paid $2.60 billion and generated $2.89 billion. The two figures crossed over a decade ago, and the argument since then has been about how far apart they should sit.
The title of this post says the dividend has caught up to the cash flow. That is half right. The payout was reset in 2016 to a level the business could carry, and the free cash flow line has covered every dividend dollar since. But the cushion is thinner now than it was at any point in the last five years, and the reason is not the dividend. It is capital spending.
My thesis is that Kinder Morgan’s dividend is safe on this evidence, but the cover has narrowed from 1.75 times in 2021 to 1.11 times in 2025 because the company is spending on growth again, and the stock at $32 is priced as if that spending will pay.
What the 2016 reset did
DB records show a dividend of $1.93 a share in 2015 and $0.50 in 2016, a cut of 74%. A company that had paid out three times what it generated in free cash flow (a cover of 0.34 times) rebuilt its payout from a base it could fund.
The rebuild was slow. Dividends per share rose to $0.95 in 2019, $1.1025 in 2022 and $1.165 in 2025. Set against 2015, the 2025 figure is still 40% lower. Cash dividends paid tell the same story in dollars: $2.60 billion last year against $4.22 billion ten years earlier.
Every year since 2016 has shown a cover above 1.0, and the run from 2017 through 2025 averaged 1.29 times. That is the caught-up part of the story. It is a plain result: after the cut, the dividend stayed well within what the pipelines produced.
The cover has been shrinking
Now the part the title skips. Cover peaked at 1.75 times in 2021, when free cash flow was $4.43 billion. It was 1.65 times in 2023, 1.18 in 2024 and 1.11 in 2025.
Free cash flow itself fell from $4.17 billion in 2023 to $2.89 billion in 2025, a drop of 31% in two years. The dividend rose the whole time, but only by about 3% ($2.53 billion to $2.60 billion). The shortfall came from the other side: capital expenditure was $1.28 billion in 2021 and $3.03 billion in 2025, more than double.
I read that as a choice. Free cash flow is measured after growth spending, so a company that decides to build more pipeline shows less of it. The question for a dividend holder is whether the projects earn a return that restores the cash later. The income statement says something about that. Operating profit was $4.72 billion in fiscal 2025, a 28% margin, against $4.07 billion in 2022. Profit is growing while free cash flow is not, which is what heavy investment looks like at the start of the cycle.
| Fiscal year | Free cash flow | Dividends paid | Cover | Capital spending | Dividend per share |
|---|---|---|---|---|---|
| 2015 | $1.42B | $4.22B | 0.34x | $3.90B | $1.930 |
| 2016 | $1.88B | $1.27B | 1.47x | $2.88B | $0.500 |
| 2019 | $2.48B | $2.17B | 1.14x | $2.27B | $0.950 |
| 2021 | $4.43B | $2.52B | 1.75x | $1.28B | $1.073 |
| 2023 | $4.17B | $2.53B | 1.65x | $2.32B | $1.125 |
| 2024 | $3.01B | $2.56B | 1.18x | $2.63B | $1.145 |
| 2025 | $2.89B | $2.60B | 1.11x | $3.03B | $1.165 |
Read the table by rows. In 2021 the company spent $1.28 billion on capital projects and paid $2.53 billion in dividends, with $4.43 billion left over. By 2025, projects took $3.03 billion, dividends $2.60 billion, and $2.89 billion of free cash flow remained. Operating cash flow, the sum before capital spending, went from roughly $5.7 billion to $5.9 billion over those four years, so the business earned about the same and simply reinvested more of it.
Two ways to measure the payout
Payout ratios on this stock depend on which earnings you pick. Fiscal 2025 diluted earnings were $1.37 a share. The dividends declared for the year came to $1.165, a payout of 85% of earnings. On the trailing twelve months the snapshot shows earnings of $1.55 and dividends of $1.18, or 76%. Both are comfortable for a pipeline company, and the second is better because earnings grew.
The forward view is less kind. The forward P/E is 22.9 against a trailing 20.5, and forward earnings are $1.39 against trailing $1.55. I read that as analysts modeling lower earnings than the last twelve months, though I do not have the reason from the data and would not guess. It is one reason I would not call the payout risk-free.
Compare the two measures with the cash view. Earnings cover the dividend 1.3 times. Free cash flow covers it 1.11 times. Earnings include non-cash items, so the cash figure is the tighter one and the one I would trust.
What the business looks like now
Spending more and earning the same is a normal stage for a pipeline owner, and it is also the stage where investors need patience. The payoff, if it comes, shows up in operating profit first and free cash flow a year or two later.
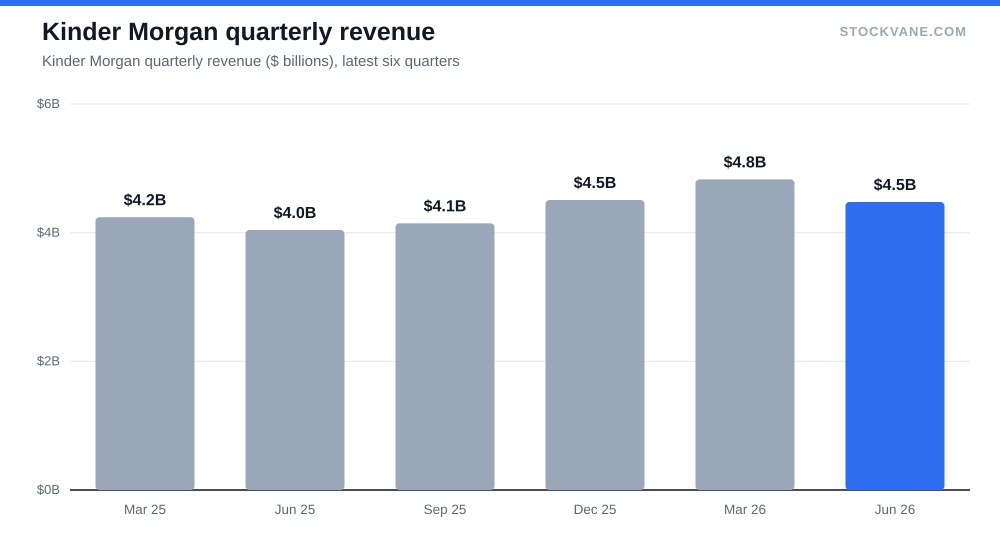
The latest quarter, the second of 2026, brought $4.5 billion of revenue, up 11% on a year earlier. Natural gas pipelines produced about 60% of the quarter’s segment revenue, products pipelines 20%, terminals 12% and CO2 8%. Ownership of the gas network is the core of the equity story, and it is the segment most tied to demand growth for gas-fired power. For the same theme applied to a regulated utility, see NextEra and the electricity demand boom.
Profit in fiscal 2025 was $3.2 billion, against $2.49 billion in 2023, a rise of about a quarter in two years. The company reported earnings on July 22, and the shares moved +0.9% the next session, against an average earnings-day move of 2.4%. Kinder Morgan is not a stock that gaps on results.
Valuation and what the Street sees
The price is $32, 7.7% below the 52-week high of $34 and about 29% above the low of $25. Market value is $70.9 billion. The trailing P/E of 20.5 sits just under its five-year average of 20.8, which says the stock is priced near its own history and not at a discount to it.
The dividend yield is 3.69%. That is modest for a pipeline. Anyone who buys for income should set it against alternatives and against what dividend growth adds over time, which is the argument in our guide to high dividend yield against dividend growth. Kinder Morgan raised its quarterly payment from $0.2925 to $0.2975 in the second quarter of 2026, a rise of 1.7%. That is a slow ramp, not a growth story.
Of 13 analysts, 46% rate it a buy and the rest hold. The average target is $36, 14% above the price, with a range of $34 to $43. Even the lowest target sits above the current price, which is unusual and worth pricing in as a sign of how little the Street disagrees. The short position is 2.2% of float. StockVane’s quant grade moved to C from D over recent weeks.
The case against
The bear argument is short. Free cash flow has fallen for two years while capital spending rose, the cover is at its lowest since 2017, and a 3.7% yield is not generous. If growth projects cost more or earn less than planned, the cushion shrinks further, and the company can choose between slower dividend growth and more borrowing. Long-term debt stood at $30.56 billion at the end of 2025, up from $27.85 billion in 2023.
That is the risk I would take seriously. It does not read as a cut risk today, since the cover is still above 1.0. It reads as a risk to growth in the payout.
Contracts help. Pipeline revenue is largely fee-based, so cash flow is steadier than in most industries. That lowers the chance of a sudden move, but I would not lean on it beyond what the numbers show. For a comparison with another energy giant that says it is prioritizing capital discipline, see our Exxon forecast.
What I am not covering
I am not covering Kinder Morgan’s contract structure or project-level returns. The data I have is company-wide. I am also leaving the 2016 cut’s cause alone, because the database records the result and not the reasons. Nor do I try to value the CO2 and terminals segments separately, since their profit is not broken out in the data I used, and a sum-of-the-parts view would need it.
How much cushion is left in the dividend
I would hold Kinder Morgan for its dividend and accept a modest one, with a floor. If free cash flow covers dividends paid by less than 1.05 times for a full year, the story has changed from a reset dividend with a cushion to a payout that is being funded at the edge. At 1.11 times, it is 6 hundredths above that floor.
The next number is the fiscal 2026 cash flow statement, due after the January report. Free cash flow above $3.0 billion against about $2.7 billion in dividends would say the spending is turning into cash. Anything under $2.8 billion would say the cover is still shrinking.
Financial disclaimer: The content on StockVane is for educational and informational purposes only and should not be construed as professional financial advice. Stock market investing involves risk of loss.
Sources: Dividends (SEC Investor.gov glossary) (https://www.investor.gov/introduction-investing/investing-basics/glossary/dividend) · Dividends tax topic (IRS) (https://www.irs.gov/taxtopics/tc404)