
On September 15 the quantitative rating on Capital One stood at a score of 53. The next day it read 20, and by September 18 it was 19. The letter grade never moved: it was a D before the drop and a D after it. That is the quirk of a grade scale, and it is why I would rather look at the score than the letter when a model “still isn’t convinced”.
The company itself has done what it said it would. Revenue rose from $39.1 billion in 2024 to $53.4 billion in 2025, a 37% jump that is almost entirely the Discover acquisition arriving in the income statement. The stock, meanwhile, is 21.1% below its 52-week high of $257, at $202.
My view is narrow. The deal is complete and the revenue is real, but the earnings that the deal was meant to produce have not shown up in a form a scoring model can credit, and the shares at 10.7 times trailing earnings are priced as if that gap is permanent. I think the price is closer to right than the 89% buy consensus implies, and I will lay out why below.
What the reported year actually shows
Revenue is the easy half. In 2024 the company booked $39.1 billion of revenue. In the most recent quarter it booked $15.8 billion, up 27% on the year and 4% on the previous quarter, which annualizes to roughly $63.4 billion. Revenue has stopped stepping up in a single leap and is now growing at the pace of the underlying business.
Profit is the hard half. On the financials page net income was $4.8 billion in 2024 and $2.5 billion in 2025, so the company earned less on 37% more revenue. Net margin over the last five years reads 40.7% in 2021, 21.5% in 2022, 13.3% in 2023, 12.1% in 2024 and 4.6% in 2025.
That series has two stories in it. The slide from 40.7% to the low teens across 2021 to 2023 came before the deal, so Discover cannot explain it; I read it as earnings returning from an unusually strong 2021. The 2025 drop to under 5% is the acquisition year, and that is where the quarterly data is more honest than the annual figure.
One quarter carries the distortion. Diluted EPS for the quarter ended June 29, 2025 was a loss of $8.58 per share. The quarters on either side were profitable: $3.45 in March 2025, then $4.83 in September 2025. Every quarter since has stayed positive, at $3.26, $3.34 and $4.73 for the three most recent. A bank that earns between $3 and $5 per share in ordinary quarters and lost $8.58 in one has taken a one-time charge, and it makes sense to read the year through that lens.
I would not push that argument to the point of calling the loss meaningless. Reserve builds on acquired loans are real estimates of future losses, and if they prove too small they come back as further provisions. What the quarterly run tells us is that the business earns money at the level of the ordinary quarter. Whether that level is high enough is a separate matter.
The quant score, and what a D is measuring
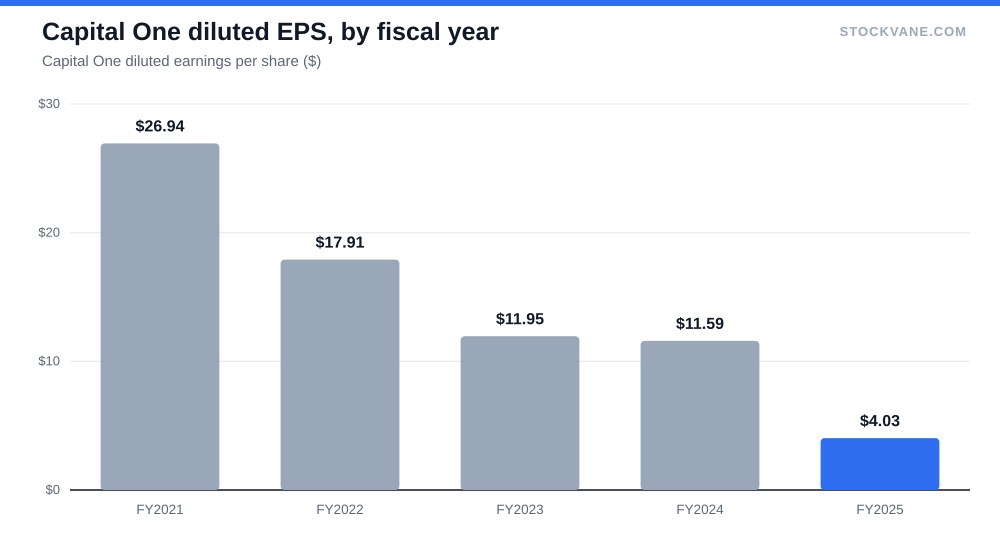
A quantitative rating combines several inputs, usually some mix of valuation, growth, profitability, momentum and analyst revisions, into one number. It cannot read a footnote about acquisition accounting. It reads the trailing figures, and the trailing figures for Capital One are ugly: EPS of $4.03 for 2025 against $11.59 for 2024, a fall of 65%.
Look at the numbers that fed it. Net income fell 48% in 2025 after falling 3% in 2024, 34% in 2023 and 41% in 2022. Four consecutive annual declines is a track record that any screen built on earnings momentum will mark down, and it should not be a surprise that the grade sits at the bottom of the scale.
The drop from 53 to 20 in one day is the more interesting fact, and I cannot tell you its cause from the data I have. The database records the score and grade, not the inputs behind a change. What I can say is that a score does not fall by 33 points because a bank’s business changed overnight; something in the model’s inputs was refreshed, and the fact that the grade stayed at D both times suggests the model was never close to a positive view.
Where the value case stands
The multiple is low, as the valuation tab shows. At $202 the stock trades on 10.7 times trailing EPS of $18.84, and the forward estimate of $17.74 puts it at 11.4 times. Implied EPS growth from the trailing figure to the forward one is -6%, which means the analyst community expects earnings to slip from here rather than recover.
The five-year average P/E of 48.9 looks like a typo, and it is a good example of why I distrust historical multiple averages for a company like this one. The five-year range runs from about negative 90 to 187, because earnings collapsed in some periods and the ratio blew up. An average of that is not a benchmark. Price to book is the better reference: 1.1 times now against 1.0 on average, a stock trading a little above its own history on the measure banks are usually judged by.
Price to sales tells a similar story from the other side. It sits at 2.0 times against a five-year average of 1.8, and the forward figure is 1.9. The stock is not cheap against its own sales history even after the drop from its high. It looks cheap only against the earnings the company reported in 2021.
A quick sanity check on whether the quant model is too harsh: the dividend yield is 1.48% on $3.00 a year, hardly a reason to own it, and 1.8% of the float is short as of the latest report. Neither number says the market is running from the stock. Neither says it is rushing in.
| Metric | Value | Context |
|---|---|---|
| Price (approx.) | $202.43 | 52-week range $174 to $257 |
| P/E (TTM) | 10.7x | Five-year average 48.9x |
| Price-to-sales | 2.0x | Five-year average 1.8x |
| Analyst ratings | 89% buy, 11% hold | 19 analysts; average target $259 |
| Dividend yield | 1.48% |
The business underneath
The most recent segment split shows Credit Card producing 74.2% of revenue at $11.8 billion for the quarter, Consumer Banking about 20.2% at $3.2 billion, and Commercial Banking around 5.4% at $850 million. This is a credit card company that has a bank attached to it, and the Discover purchase makes the concentration more pronounced, not less.
That matters for a reason the income statement does not show. Card earnings depend on the loss rate in a downturn, and a portfolio that is three quarters of revenue has no offset from other lines. If unemployment rises, the provisions that the acquired book needed on day one may look modest in hindsight. For a payments-focused comparison, the Visa toll-road piece makes the case for owning the network rather than the lender, and the trade-off it describes is the reason the two stocks do not carry the same multiple.
What analysts and the tape are saying
Nineteen analysts cover the stock and 89% rate it a buy, with the rest at hold and none at sell. The average target of $259 sits 28% above the price. Even the lowest target, $222, is 10% above where the shares trade, while the highest, $300, implies 48%.
I distrust a target range with no target below the price. It tells you what analysts think of the business and very little about the price, since sell-side models rarely price in a bad case. The gap between a D on the quant side and 89% buys on the analyst side is the whole debate, and the two disagree because they are looking at different periods: one reads the trailing year, the other reads the year to come.
The stock’s reaction to earnings shows which view the market has favored. The last four reports produced moves of +1.5% in October 2025, -7.6% in January, -1.5% in April and -2.4% on 2026-07-21. Three straight declines after results, against an average absolute move of 3.2%, suggest that each report has confirmed the caution rather than dispelled it.
For context on how the market treats large lenders more broadly, JPMorgan at a record high is the counter-example: a bank the market is paying up for because its earnings are steady. The distance between the two multiples is what Capital One would have to close.
What I am not covering
I am not trying to forecast credit losses, and I have not modeled the synergy figures management has discussed, because I have no measured data on either in the database. Nor do I have a view on the legal and regulatory matters surrounding the acquisition. Those could move the stock in either direction, and none of them is captured in the numbers above. The Fed’s September 16 hike matters for funding costs and for consumer credit demand, and I would treat it as a background variable in this stock rather than a cause of anything in the data.
The score I would wait for
The grade will not leave D on a single good quarter. The score has to climb well back above the 53 it held two weeks ago, and I would want to see it hold there for more than a few days before treating it as information. A jump to 53 that lasts a week and reverses is noise in the other direction.
The fundamentals that would earn it are simple to state. Quarterly EPS needs to stay at or above roughly $4.73, the level of the most recent quarter, through the next report, and the forward estimate of $17.74 needs to stop sitting below the trailing $18.84. If the next quarter’s revenue holds near $15.8 billion while EPS goes up, the model’s earnings inputs will start to improve without any narrative help.
If instead EPS slips toward the $3.26 to $3.34 range of the two quarters before, the -6% implied decline will look optimistic, and a D will be the correct grade for a stock at 10.7 times earnings. That is the level I would use to decide whether the model or the analysts are right.
Financial disclaimer: The content on StockVane is for educational and informational purposes only and should not be construed as professional financial advice. Stock market investing involves risk of loss.
Sources: Dividends (SEC Investor.gov glossary) (https://www.investor.gov/introduction-investing/investing-basics/glossary/dividend) · Dividends tax topic (IRS) (https://www.irs.gov/taxtopics/tc404)