
Visa earned about $73 million of operating income for every calendar day of its last fiscal year. Weekends, holidays, the morning you read this. That is $26.6 billion on $40.0 billion of revenue, and it is the number any bypass has to be measured against.
The bypass in question is familiar by now: instant bank-to-bank transfers, account-to-account payments, stablecoins settling outside the card networks. The question I keep getting is whether that is finally the threat, or one more story that keeps not arriving. I cannot measure a stablecoin’s market share from our database, and I will not pretend to. What the database does hold is the toll road’s own traffic count, and that is where the argument has to be settled first. My thesis: the threat is real but slow, the toll road is still growing about 11% a year, and at 31.3 times trailing earnings the stock already prices in a good deal of that growth surviving.
What the traffic count says
Start with revenue. Visa booked $40.0 billion in fiscal 2025, up 11% from $35.9 billion the year before, and $29.3 billion in fiscal 2022. Three years, compounded, is about 10.9% a year. The series is not a straight line: fiscal 2020 fell 5% when travel stopped, fiscal 2021 recovered 10%, fiscal 2022 jumped 22% as cross-border spending came back, and the last three years have settled at 10% to 11%. A business that grows 10% to 11% for three straight years after the reopening bounce has run its course is telling you something about the base rate.
The most recent quarter is the more interesting read. The quarter reported on 2026-07-28 came in at $11.6 billion, up 14% from a year earlier and 4% above the prior quarter. The four quarters before it grew 12%, 15%, 17% and then 14%. None of them slowed to single digits. If stablecoins or account-to-account rails were pulling meaningful volume off the network today, this is the line where you would expect the first sag. It has not appeared.
Two cautions. First, a quarterly growth rate of 14% partly reflects price and mix, not only volume, and I cannot separate them here. Second, a payments network can look healthy right up until a large merchant or a regulator forces a change in how it is paid. The revenue line is a lagging witness.
The margin question
Operating income reached $26.6 billion in fiscal 2025, a 66% operating margin. That is the number I would use. Our database also carries an EBIT margin series that reads 62.0% for the same year, down from 68.4% in fiscal 2024, and I cite the operating figure because it ties directly to the reported income statement while I cannot see what the other series adjusts for. If you prefer the lower one, the conclusion barely changes: nearly every second dollar of revenue still lands as profit.
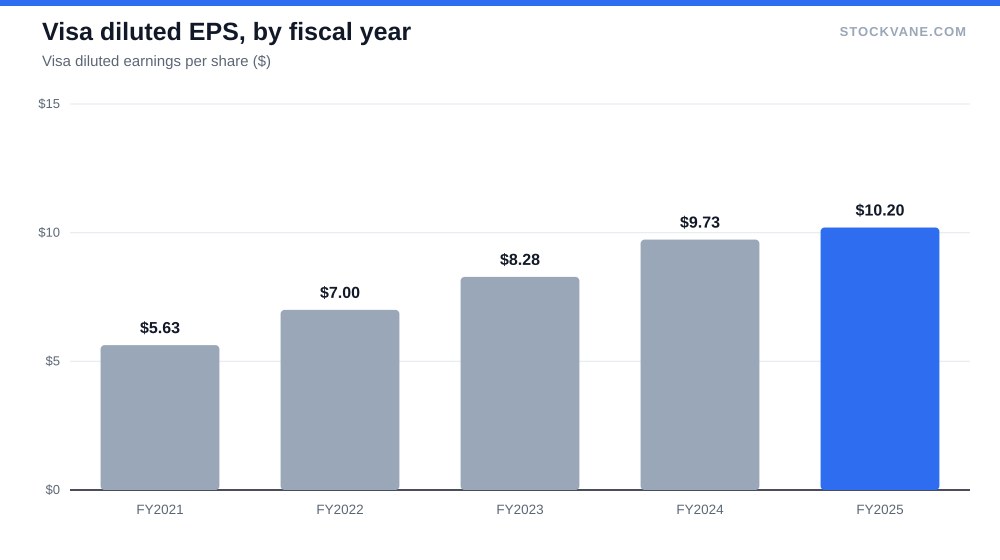
Net income tells a slightly different story. It rose to $20.1 billion from $19.7 billion, only 2% higher, while operating income grew about 10%. Diluted EPS moved from $9.73 to $10.20, up 5%. I do not have a filing in front of me that explains the gap between those two growth rates, and I will not guess at a cause. What I can say is that a stock priced for 20%-type earnings growth should not be treated to a year in which profit growth came in at a quarter of that. The trailing figure has since improved: trailing EPS is now $11.75, against fiscal 2025’s $10.20, a rise of about 15% in three quarters.
The Visa financials page shows the full run of these series if you want to check my arithmetic.
| Fiscal year | Revenue | Growth | Operating income | Operating margin |
|---|---|---|---|---|
| FY2020 | $21.85B | -5% | $14.09B | 64.5% |
| FY2021 | $24.11B | +10% | $15.81B | 65.6% |
| FY2022 | $29.31B | +22% | $19.68B | 67.1% |
| FY2023 | $32.65B | +11% | $21.93B | 67.2% |
| FY2024 | $35.93B | +10% | $24.06B | 67.0% |
| FY2025 | $40.00B | +11% | $26.56B | 66.4% |
| Metric | Value | Context |
|---|---|---|
| Price (approx.) | $368.29 | 52-week range $293 to $386 |
| P/E (TTM) | 31.3x | Five-year average 32.3x |
| Price-to-sales | 15.6x | Five-year average 16.3x |
| Analyst ratings | 96% buy, 4% hold | 27 analysts; average target $429 |
| Dividend yield | 0.71% |
What you pay for it
At $368.29, Visa sits 4.5% below its 52-week high of $386 and 26% above its low of $293. The market value is $688.8 billion. The trailing P/E of 31.3 compares with a five-year average of 32.3, so the stock trades almost exactly on its own history, at roughly the 49th percentile of that range. On the forward numbers the multiple drops to 25.9, because forward EPS of $14.23 implies 21%% growth over the trailing figure. The industry average forward-looking P/E in our data is 22.1.
Price to sales is the more sobering measure. Visa trades at 15.6 times sales against an industry average of 5.0, and price to book of 19.7 sits in the 99th percentile of its own five-year band, which averaged 14.9. Book value is a weak yardstick for a company that returns most of its cash, so I would not lean on that last one. But the sales multiple says plainly that investors are paying for margin, not for size.
Here is the arithmetic I would keep on a card. Forward EPS of $14.23 at the five-year average P/E of 32.3 is $459. The same EPS at 22 times, the industry average, is $313, which is right at the 52-week low. The stock does not have to fall to 22 times for the bypass thesis to hurt; it only has to lose the premium it earns from a growth rate that looks safe. If trailing EPS grows 10% instead of the implied 21%% and the multiple stays at 25.9, the price arrives at $335, 9% below today’s quote. Put simply, today’s price needs growth well into the teens to hold; anything less is a cost.
The counter-case, taken seriously
The bull case for the bypass is not silly. Payment networks charge a percentage of every transaction, and a percentage is an easy target: a merchant or regulator who can route around it saves real money on large tickets. The margin the company earns is the size of the prize for anyone who builds the alternative. My honest view is that the routes around card networks have been under construction for a decade, and the DB’s five-year revenue record shows no dent. But that is precisely why I am wary of a valuation that assumes there never will be one.
What would make me wrong on the slow-threat reading is a concrete condition: quarterly revenue growth falling below 10% for two consecutive quarters without a matching slowdown in the wider economy. One quarter could be travel, weather or an exchange-rate quirk. Two in a row would be a pattern.
The other side of that ledger is the analyst read. 27 analysts cover the stock, 96% rate it a buy, and the average target of $429 sits 16%% above the price; the lowest target of $403 is still 9%% higher. A room this unanimous is not evidence against the stock, but it does mean the disappointment side is thinly covered. Our own quant grade for Visa slid to D from C in recent weeks, which I read as a comment on price momentum and valuation rather than on the business. Short interest is only 1.1% of float, so nobody is betting hard against it.
Income and cash
The dividend is a footnote, and a fair one. The yield is 0.71%, from $2.60 of payments over the last twelve months. Anyone weighing this against income stocks should read the trade-off in High Dividend Yield vs Dividend Growth, because Visa belongs squarely on the growth side of that argument. You are not paid to wait. You are paid, if all goes well, by the compounding of profit and a buyback that shrinks the share count.
Where I would place it among the giants
Visa’s premium sits in a different neighborhood from the ones I have written about recently. JPMorgan at a record high is a bet on a lender at 15 times earnings; Visa asks twice that multiple for a business that takes no credit risk. Costco at 50 times earnings is the other extreme of paying for durability. Visa’s advantage over both is the 66% operating margin. Its disadvantage is that the margin invites competitors.
I am not covering the regulatory and litigation calendar here, because it is not in our data and I would be quoting from memory. If you own the stock, that is homework worth doing separately.
Earnings react mildly: the average one-day move on report day is 3.4%, and the last one was +0.6%. This is not a stock that punishes a quarter with a large gap, which is part of why the reasoning about growth thresholds matters more than the report itself.
The growth rate I would not pay 25.9 times for
The toll road is being tested slowly, not suddenly. A stock at 25.9 times forward earnings has paid for a business that keeps growing revenue in the low double digits and earnings faster still. Hold Visa to that.
The next number is the fiscal fourth-quarter report; the same report a year ago came on October 28. The last four quarters grew between 12% and 17%. If revenue growth prints under 10%, I would call the bypass early, and I would not want to own it at today’s $368 without a lower entry. If it prints at 12% or better, the multiple is defensible and the debate moves on.
Gavin Thorne has invested in U.S. stocks for six years and previously worked at a large publicly traded internet company. He writes about income-oriented strategies, including cash-secured puts, and about how he reads company data. This article reflects his personal research process and is for informational purposes only. It does not constitute investment advice.
Sources: Dividends (SEC Investor.gov glossary) (https://www.investor.gov/introduction-investing/investing-basics/glossary/dividend) · Dividends tax topic (IRS) (https://www.irs.gov/taxtopics/tc404)