
Constellation Energy trades 37.9% below its 52-week high of $410. Yet the forward EPS analysts carry, $11.67, sits within 2% of the $11.89 the company earned in fiscal 2024, the best of the six years in the database. Something does not add up, and I would like to work out which side is wrong.
The title of this post promises a nuclear restart that nobody priced in. I cannot verify a restart from the numbers I have. The database carries no plant-level or project-level data, and a search of its news feed for Constellation turned up no restart item. So I will not claim one. What I can test is the second half of the sentence: was the earnings power priced in, and by how much? The answer is that it was priced in, at the peak, and then a good part of it was taken back out.
My view is that $255 is a fair price for a business that earned $7.40 a share in 2025 and is expected to earn about $11.67 next, but that the quant model’s E grade and a run of analyst target cuts say the market is waiting for one specific number before it pays more.
The margin curve everyone remembers
Start with operating income over revenue, which I compute directly from the financials page. It was 1.8% in 2021, -1.7% in 2022, 9.6% in 2023, 20.6% in 2024 and 16.5% in 2025. (The database’s own EBIT margin for 2025 is 15.8%; the difference is definitional and I use the first figure here.)
Revenue barely moved through the middle of that run: $24.4 billion in 2022, $24.9 billion in 2023, $23.6 billion in 2024, $25.5 billion in 2025. So the jump from a loss of $0.41 billion in 2022 to a profit of $4.85 billion in 2024 came almost entirely from price and mix, not volume. Same revenue, a $5.26 billion swing in operating profit. That is the nuclear-premium story in one line, and it is real.
But 2025 went the other way. Operating income fell from $4.85 billion to $4.20 billion, and net income fell 38%, from $3.74 billion to $2.3 billion, even though revenue rose 8%. Gross margin dropped from 25.4% to 18.4%. A company that adds 8% to sales and loses 38% of its profit has told you that the premium it earned in 2024 was not fully repeatable.
Profit fell while sales rose. Read that twice.
Higher sales, lower profit: that is the fact the 2024 peak cannot be read around.
What “priced in” means at this price
The trailing P/E is 24.9 and the forward P/E is 21.8. The industry average in the same data is 25.5, so Constellation trades at about the sector multiple, on earnings that analysts think will rise 14% from the trailing $10.23 to $11.67. That is not a stock priced for extraordinary growth. It is priced as an ordinary power company with a slightly better year ahead.
The five-year average P/E of -7.9 is negative because of the loss years, so I would not use it. The price-to-sales ratio is a better yardstick: 3.0 now against a five-year average of 2.4 and a band of 1.2 to 3.7, the 61st percentile. The industry sits at 1.9. The stock is priced higher than its own history and higher than peers on revenue, but below the middle of its range on book value, at 2.9 times against a five-year 4.5 and an industry 4.1.
Read together, the valuation says the market pays a modest premium on sales and no premium on earnings. If earnings growth came in at the 14% analysts expect, then the forward multiple of 21.8 is fair. If it came in at zero, then the stock would sit on 24.9 times and most of the discount to the high would be justified. That is the range I would work in, and the valuation tab has the bands if you want to check the percentiles.
The pieces that changed in 2026
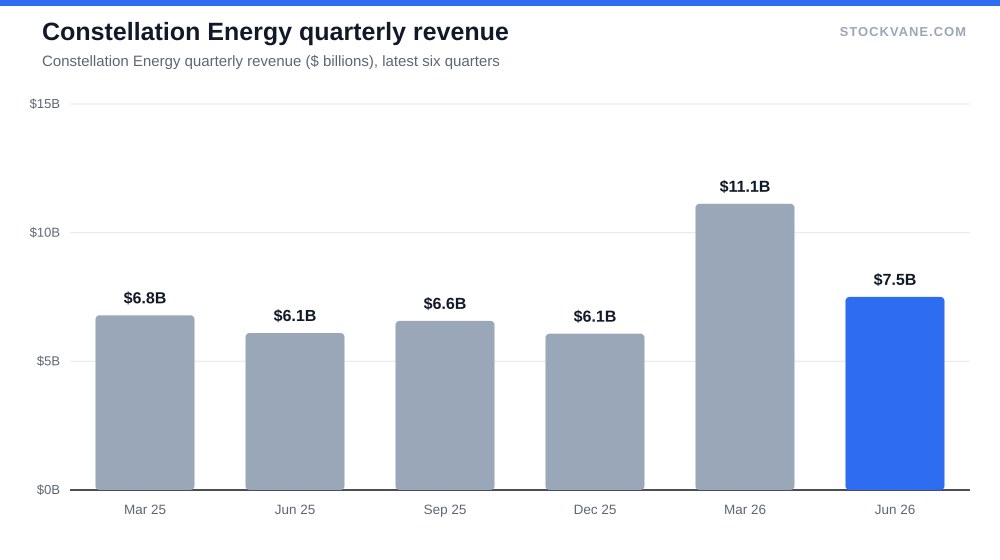
The June quarter shows a different company from the one that filed the 2025 accounts. Revenue was $7.5 billion, up 23% from a year earlier and down 33% from the prior quarter’s $11.12 billion. Calling that a run rate of $30.0 billion would be silly, since the sequential swing tells you the quarters are lumpy. I would look at the year-over-year figure only.
The segment split is new. Calpine now appears as its own line, at $2.15 billion or 28.6% of segment revenue in the June quarter, ahead of Midwest at $1.57 billion (20.9%), Mid-Atlantic at $1.56 billion (20.7%), other power regions at $0.96 billion (12.8%), New York at $0.56 billion (7.5%) and ERCOT at $0.45 billion (5.9%). I take from that that the fleet has become more diversified across regions, which is good for volatility and less good if you bought the stock as a pure nuclear play. The database does not say how much of any segment is nuclear, so that share is the number I do not have.
For context on the demand argument that lifted the stock, the NextEra post makes the electricity-demand case from the regulated-and-renewables side, and the piece on power as the AI bottleneck explains why the market cared. Neither needs repeating here.
The counter-case, and why the analysts have been cutting
The strongest evidence against my cautious reading is the analyst tally. 18 analysts cover the stock, 83% say buy, none say sell. The average target is $349, 37% above the price, and even the lowest, $290, sits 14% above it.
Now look at the direction of travel. In August, Morgan Stanley kept its Buy but cut its target to $364. Mizuho, at Hold, cut to $290. Argus, at Buy, cut to $325. BNP Paribas and DBS initiated at Buy with $374 and $350. Targets are coming down from a higher base while the ratings stay bullish, which is what people do when they like the business and dislike the price they paid to own it. I read the ratings as intact and the target cuts as the honest signal.
The quant grade agrees with the cuts. It was C with a score of 57 on September 14 and E with a score of 11 on September 21. I do not have a news item that explains the fall, and I will not invent one. The same day the grade moved lower, a Form 144 headline reported that an officer proposed to sell 5.41 million in common stock; the headline does not say whether that is shares or dollars, and a proposed sale is not a completed one. I mention it because it sits in the same news feed, not because I can tie it to anything.
The reaction to the last report was small. The June-quarter earnings move was -1.5%, against an average move of 2.8%. Short interest is 3.3% of float, about 5.0 days to cover. Neither number says the market is panicked.
A note for income readers
I write mostly about income, so I checked. The yield is 0.64% on $1.63 of dividends over the past twelve months. That is not an income stock, and I would not sell puts on it expecting to be paid mainly in dividends. Compare Energy Transfer, the other name in this research pack: a 6.32% yield, a P/E of 14.5, and operating income that has moved in a narrow range from $8.1 billion to $9.3 billion since 2021. Constellation earns a great deal more per dollar of revenue, but ET pays you to wait. Different jobs.
| Metric | Value | Context |
|---|---|---|
| Price (approx.) | $254.71 | 52-week range $228 to $410 |
| P/E (TTM) | 24.9x | Five-year average -7.9x |
| Price-to-sales | 3.0x | Five-year average 2.4x |
| Analyst ratings | 83% buy, 17% hold | 18 analysts; average target $349 |
| Dividend yield | 0.64% |
Where I could be wrong
Two conditions. First, if 2026 operating margin lands near the 2024 figure of 20.6%, then 2025 was the trough and the forward EPS of $11.67 is too low. The market would be paying 21.8 times for earnings that turn out to be higher, and the discount to the high would look like an opportunity. Second, if margin stays near or below the 2025 level of 16.5% while the fleet gets bigger, then more assets brought in with lower-margin contracts are diluting the business, and 21.8 times is not cheap.
I am not covering plant-level economics, contract terms or the regulatory side, because the database does not carry them. If the restart in the title is a real project, its effect would appear in the numbers above as a margin or volume change, and I would rather wait for it to show up than argue it in advance. Lending weight to a thesis I cannot check would be a mistake, so I am leaving it out. For a comparison of how a stock can look cheap while a margin problem is still unresolved, UnitedHealth’s margin story is a useful parallel.
The print that answers the title
The number I would watch is operating margin on the next annual figures. Above 18%, I would say the 2024 premium is coming back and the forward EPS is conservative. Below 16.5%, I would say 2025 was the new normal, and I would want a better price than $255. Between the two, the stock is fairly priced and there is no edge in either direction.
Gavin Thorne has invested in U.S. stocks for six years and previously worked at a large publicly traded internet company. He writes about income-oriented strategies, including cash-secured puts, and about how he reads company data. This article reflects his personal research process and is for informational purposes only. It does not constitute investment advice.
Sources: Dividends (SEC Investor.gov glossary) (https://www.investor.gov/introduction-investing/investing-basics/glossary/dividend) · Dividends tax topic (IRS) (https://www.irs.gov/taxtopics/tc404)