
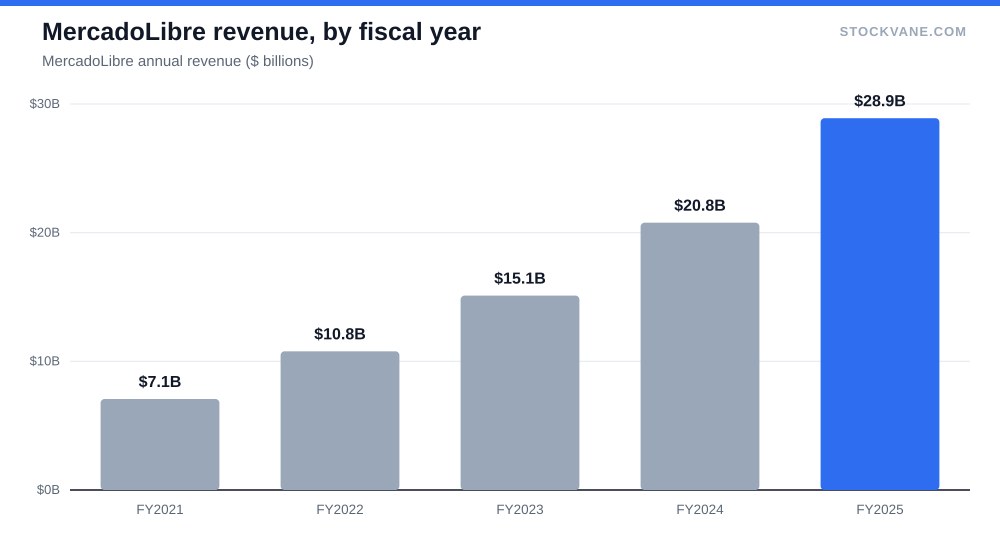
MercadoLibre grew revenue 39% in 2025. Amazon grew 12%. On price per dollar of sales, though, the Latin American company costs 2.6 times revenue and Amazon costs 3.6. That is the first thing I check when someone tells me a stock is cheap for what it does, and here it holds up: more than three times the growth, for about 28% less per dollar of sales.
The comparison in the title, that MercadoLibre is Latin America’s Amazon and does not trade like it, is right about sales and wrong about profit. On the trailing P/E in our data, MercadoLibre sits at 48.6 and Amazon at 20.4. Whatever discount exists lives in the sales multiple. On earnings, the market is paying more than twice what it pays for Amazon. My argument in this piece is that this is not a mispricing to close but a bill for one number: how little of MercadoLibre’s revenue growth has reached the income statement’s last line.
Two companies with the same margin and very different growth
Start with what is similar. MercadoLibre’s operating income was $3.2 billion on $28.9 billion of revenue in 2025, an operating margin of 11.1%. Amazon made $79.97 billion on $716.92 billion, or 11.2%. Those two figures differ by a tenth of a point. If you had told me in 2020 that the Latin American marketplace would end up earning the same operating margin as the company it is compared to, I would have doubted it. Amazon then earned 5.9% and MercadoLibre 3.2%.
Now the differences. MercadoLibre’s revenue has grown from $3.97 billion in 2020 to $28.9 billion in 2025, with annual growth rates of 78%, 52%, 40%, 38% and 39% in the years since. Amazon’s growth over the same stretch was 22%, 9%, 12%, 11% and 12% off a base roughly 25 times larger. The latest quarter tells the same story: MercadoLibre took in $10.2 billion, 50% more than a year earlier, and Amazon’s most recent quarter was up 20%, its fastest pace in the series we track.
So MercadoLibre is growing growing about three times faster than Amazon, and about twice as fast as Amazon at its best, and earns the same operating margin on it. Priced at Amazon’s 3.6x sales, MercadoLibre would trade near $2,490. It closed at $1,787.39, and its 52-week high is $2,548. Read the stock’s discount to Amazon on sales as roughly the distance to that high.
| Metric | MercadoLibre | Amazon |
|---|---|---|
| Revenue growth, FY2025 | 39% | 12% |
| Operating margin, FY2025 | 11.1% | 11.2% |
| Net margin, FY2025 | 6.9% | 10.8% |
| Price to sales | 2.6x | 3.6x |
| Trailing P/E (snapshot) | 48.6 | 20.4 |
That is the good half of the story.
Where the profit got lost
Here is the part that keeps me from calling this cheap. Revenue rose 39% last year, and net income rose 5%, from $1.9 billion to $2.0 billion. Diluted earnings per share went from $37.69 to $39.40, a rise of 5%. Operating income grew 22%, which is real but still well below revenue growth.
The financials tab shows where the margin went. Operating margin peaked at 14.6% in 2023, dropped to 12.7% in 2024 and finished 2025 at 11.1%. The gross margin fell from 49.8% in 2023 to 46.1% and then 44.5%. Revenue growth at that speed is expensive to produce, and the cost lands in the margin.
I do not read the pullback as a warning by itself. A business that spends heavily on shipping, credit provisions and customer acquisition to add 39% a year in revenue is choosing to trade margin for share. In the second quarter of 2026, credit revenues alone were $2.28 billion, 22.4% of the quarter’s revenue, and financial services another 20.8%. A lending book books its losses up front and its interest later. Growth in that book pushes reported profit down before it pushes it up.
That is an explanation, and it may be a good one. It is also the same explanation every company gives while margins fall. What would distinguish it from an excuse is the trend in the next four quarters: if credit revenue keeps growing faster than the marketplace while operating margin stops falling, the lending story is working.
The earnings multiple has no discount in it
The P/E answers the title. At 48.6 trailing and 47.2 on forward earnings of $37.86, the stock is priced for almost no profit growth in the coming year: the forward EPS is only 3% above trailing. Amazon’s forward P/E in our data is 26.9, against a snapshot trailing figure of 20.4.
A caution on that trailing number for Amazon. Its snapshot P/E of 20.4 uses the latest twelve months, and its fiscal 2025 diluted EPS of $7.17 at today’s $253.71 would give 35 times. Whichever you prefer, Amazon is cheaper than MercadoLibre on earnings. For MercadoLibre to have Amazon’s 20.4 times on the current price, trailing EPS would need to be $88 instead of $36.76, which is 2.4 times higher.
Within its own history, the stock does look cheap on sales. The current ratio of 2.6 sits below the low end of its five-year band, which runs from 3.4 to 7.8 with a five-year average of 5.6. The valuation tab puts that in the first percentile. The earnings side is unhelpful, since the five-year average P/E is distorted by years of near-zero profit, and I would not lean on it.
| Metric | Value | Context |
|---|---|---|
| Price (approx.) | $1,787.39 | 52-week range $1,495 to $2,548 |
| P/E (TTM) | 48.6x | Five-year average -693.0x |
| Price-to-sales | 2.6x | Five-year average 5.6x |
| Analyst ratings | 78% buy, 22% hold | 9 analysts; average target $2,266 |
What the analysts and the tape say
Nine analysts cover the stock and 78% rate it a buy. The average target of $2,266 implies 27% upside, the highest target of $2,450 implies 37%, and the lowest, $2,000, still sits 12% above the price. Our news feed shows the mix in miniature: BTIG kept its Buy with a $2,150 target on September 3, and J.P. Morgan kept a Hold and raised its target to $2,150 on August 11. Two firms with opposite ratings, the same price target.
I would not lean on either. The tape has been worse than the ratings. The stock is 29.9% below its 52-week high and only 20% above its low of $1,495. It fell 4.8% after the August 5 report and 12.69% after the May 7 report, against an average earnings-day move of 7.1%. Our quant grade went from B two weeks ago to E, a score of 6 today. The grade leans on momentum, so I would not read it as a verdict on the business. It does say the market has been selling the growth story for months.
What would make me wrong
I can name the conditions. The cheap-on-sales case fails if revenue growth, which has held between 38% and 40% a year for three years, falls toward Amazon’s 12%. At that point the sales multiple should converge toward Amazon’s or below, and 2.6 would no longer be a discount. It also fails if operating margin keeps sliding: another three points from 11.1% would put it at 8% and cut trailing profit by more than a quarter.
The other side of that arithmetic is what makes the stock interesting. Suppose operating margin merely holds at 11% while revenue grows at half of last year’s pace. Profit still grows at about 20% a year, and a 48.6 multiple on that is much easier to defend than it looks today. The Latin American markets and currencies these sales are earned in are a risk I am not covering, because our database has no data that measures them, and a reader should treat it as a separate open question.
For anyone who likes to be paid while waiting, I wrote about selling puts as a way to set the price at which you would own something. The stock’s 52-week low of $1,495 is 16% below the current price, and that is a level I would think about before any strike. I would not do it blindly, since the earnings-day moves here have been large.
There is one more comparison worth a mention. Walmart is another retailer that the market has started pricing on a technology-company multiple, and the debate about whether that multiple is earned looks a lot like this one. MercadoLibre is the case where the growth is real and the margin is not yet.
The earnings line that closes the gap
The number I would hold it to is net margin, currently 7% against Amazon’s 10.8%. If it moves up to 9% on unchanged revenue, earnings per share would be about 48 instead of $36.76, and the trailing multiple would fall from 48.6 to about 37. That is the difference between looking expensive and looking like a reasonable price for a company that grows 39%.
If net margin is still near 7% a year from now on revenue of $40 billion, $40.7 billion being the current run rate, the discount on sales will have been earned. If it has moved toward 9%, the P/E is where the discount is hiding.
Gavin Thorne has invested in U.S. stocks for six years and previously worked at a large publicly traded internet company. He writes about income-oriented strategies, including cash-secured puts, and about how he reads company data. This article reflects his personal research process and is for informational purposes only. It does not constitute investment advice.
Sources: Price-to-earnings ratio (SEC Investor.gov glossary) (https://www.investor.gov/introduction-investing/investing-basics/glossary/price-earnings-pe-ratio) · Earnings reports (SEC Investor.gov glossary) (https://www.investor.gov/introduction-investing/investing-basics/glossary/earnings-report)