
Cloudflare lost $102 million in fiscal 2025 by the accounting rules, and its operations generated $603 million in cash the same year. Both numbers are correct. They describe the same company from two different sides, and the distance between them is what this post is about.
The trailing P/E is -557.9. It is a real figure in the data and a useless one, because a ratio needs a positive denominator, and Cloudflare’s trailing GAAP earnings per share are $-0.58. Whenever a stock like this comes up, the objection arrives on cue: why own something that loses money? Fair question. Answering it takes more than saying “growth”, so I checked what the filings-based numbers show in cash, in margins and in the price.
My view is that the loss is the smaller part of the picture and the price is the bigger one. Cloudflare’s operating losses have narrowed as a share of sales while cash generation turned clearly positive, but at $323.60 the market cap of $115.2 billion already assumes years of that continuing, and the valuation gauges show how little room that leaves.
The losses are real, and they are not shrinking in a straight line
Start with the operating margin, operating profit over revenue, by fiscal year: -24.8%, -19.5%, -20.6%, -14.3%, -9.3%, -9.5% from 2020 through 2025. Follow the sequence. The loss narrowed from 2022 onward, to a low of -9.3% in 2024. Then 2025 gave back a little, at -9.5%.
That last year deserves a direct look, because it is the year the bull case has to explain. Operating loss widened from $155 million to $207 million on revenue that grew 30%. Gross margin moved the wrong way too, from 77.3% to 74.5%, a fall of about 2.8 points. One flat year does not undo four years of progress, but it does mean that the margin has not been improving on its own. It depends on spending choices, and those can change.
The financials page has every line if you want to test this. On the question of net loss, the picture is similar: $184 million in 2023, $79 million in 2024, $102 million in 2025. Mixed, and honestly so.
Cash tells a different story
Operating cash flow was negative $17 million in 2020. By 2025 it was $603 million. That is a swing of more than $600 million in five years, on revenue that rose five-fold, from $431 million to $2.17 billion.
Free cash flow follows the same path in the database: minus $92 million in 2020, minus $43 million, minus $40 million, then positive $119 million in 2023, $167 million in 2024 and $261 million in 2025. As a share of revenue that is 12% in the latest year, against negative 21% in 2020. Something changed in 2023: the company stopped consuming cash to grow.
One caution. The database’s free cash flow figure of $261 million is well below operating cash flow of $603 million, and the listed capital expenditure line of $27 million does not explain the gap. I use both as reported and do not try to reconcile them. Subtracting capex from operating cash would give a margin near 27% for 2025, more than double the 12% the database’s own figure implies, so I stay with the database.
| Metric | Value | Context |
|---|---|---|
| Price (approx.) | $323.60 | 52-week range $159 to $338 |
| P/E (TTM) | -557.9x | Five-year average -331.4x |
| Price-to-sales | 46.7x | Five-year average 31.8x |
| Analyst ratings | 84% buy, 12% hold | 25 analysts; average target $359 |
Why should cash and operating profit diverge so far? In general, a software company with prepaid subscriptions collects cash before it records revenue, and non-cash charges such as stock compensation reduce GAAP profit without touching the bank balance. I am reading the pattern from the numbers, not from a management explanation, and the database does not break out stock compensation here. What it does establish is that the business is not burning cash, whatever the income statement suggests.
Growth is speeding up, not slowing
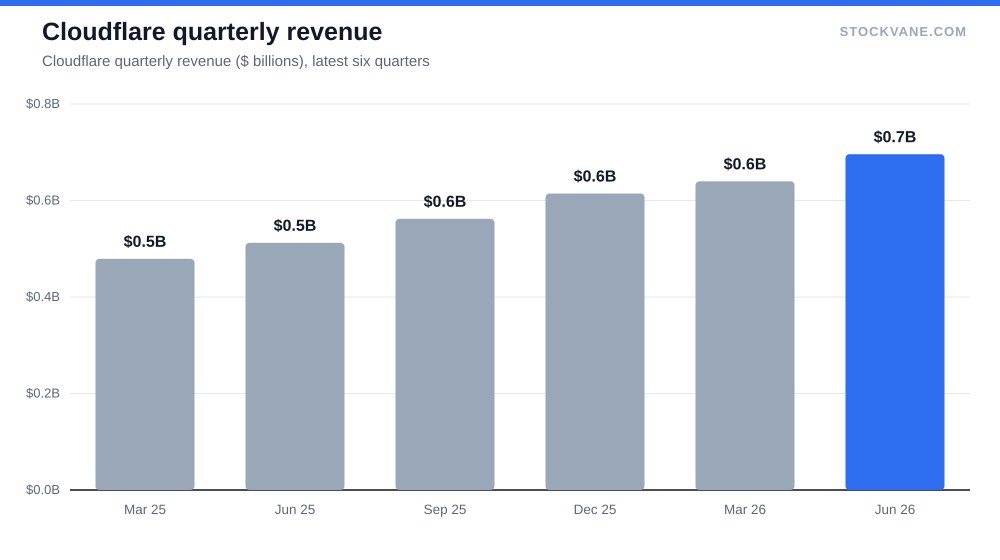
Quarterly revenue growth has run 26.5%, 27.8%, 30.7%, 33.6%, 33.5% and 35.9% over the last six quarters. The June 2026 quarter brought in $696 million against $512 million a year earlier. Annualized, the last quarter implies about $2.8 billion of revenue, against $2.2 billion for fiscal 2025.
At this size, that is unusual. Fiscal growth was 50%, 52%, 49%, 33%, 29%, 30% from 2020 to 2025. It fell to 29% in 2024 and now looks to be turning back up, which is the opposite of what the typical maturing software business does. I do not have a segment breakdown to say why, since the company reports a single segment, so any attribution to a product line would be a guess. The number is what it is: a larger base growing faster.
Our Alphabet piece argues that a cheap multiple usually carries a warning. Cloudflare is the mirror image: an expensive multiple carries a warning of its own, because the price depends on growth continuing.
What the price already assumes
The stock trades at 46.7 times sales, against a five-year average of 31.8. That is the 89th percentile of its own range. Price to book is 72.4 against 41.7, the 98th percentile, and the industry average is 8.4. On the database’s numbers, this is a stock at the top of its own valuation history on most gauges, not in the middle.
Convert that to cash. A market value of $115.2 billion against free cash flow of $261 million is roughly 441 times. The stock does not price the present. It prices what the cash flow could be in ten years, and if it grows as fast as revenue has, 30% a year compounds to about 14 times in ten years. At that rate the multiple falls from 441 to about 32 times, which is still not cheap.
I do not think the multiple is irrational. A business growing above 30% with positive cash flow and 74.5% gross margin is scarce. I think the price leaves no margin for error, and the last two earnings reactions show it: -23.6% after the May 7 report, then +5.6% on August 6. The four most recent one-day moves were +13.8%, +5.2%, -23.6% and +5.6%, an average absolute move of 12.1%. A stock that moves an average of 12% on a report is telling you the market is unsure what the number should be.
The valuation tab shows the same picture in the band chart.
The latest quarter, and what I cannot explain
The June 2026 quarter posted a net loss of $170 million, EPS of negative $0.48, against a loss of $23 million and negative $0.07 in March. Operating loss was $55 million, actually narrower than March’s $62 million. So the net loss widened by far more than the operating loss, which means something below the operating line, not the business itself, drove the jump. The data here does not say what. I would not guess at a cause without a source, and I would want to read the filing’s non-operating section before saying more.
It does mean the trailing EPS of $-0.58 is worse than the operating picture suggests, and it makes the negative P/E even less useful than usual.
What analysts think
Of 25 analysts, 84% rate the stock a buy, 12% a hold and 4% a sell. The average target is $359, 11% above the price. The range is wide: $160 at the low end, 51% below today’s price, and $400 at the high end, 24% above it. When the most bearish analyst is 51% below the market, the disagreement is about how much growth deserves a premium, not about whether the company is good. Short interest is 1.9% of float, not a crowded bet. The quant grade moved from C to B recently.
If you want to learn how to read the earnings numbers behind these ratios, the earnings report guide covers the mechanics of reading the income statement and cash flow.
What would make this wrong
Three conditions would break the case.
Revenue growth falling below about 25% would remove the rationale for the premium. It has been 26% or above for six quarters, so it is a real cushion, but for a stock at 46.7 times sales, a slide from 36% to 25% would matter.
Free cash flow margin slipping back under 10% would say the 2025 figure of 12% was the peak, not the floor. It was 9% in 2023 and 10% in 2024.
And the third: gross margin. It fell from 77.3% to 74.5% in one year. Another fall of that size would suggest the growth is being bought with lower-quality revenue.
I am not covering competitive dynamics or product roadmap. The database has neither, and I would be writing from general knowledge, which is not the standard I set for these notes.
What the loss would have to become
The claim that the loss is not the point holds as long as free cash flow keeps rising. I would watch for full-year 2026 free cash flow above the $261 million of 2025 and operating margin better than negative 9.5%. If both arrive, the accounting loss is a footnote. If cash flow stalls while revenue growth is still 30%, the premium is paying for nothing.
Financial disclaimer: The content on StockVane is for educational and informational purposes only and should not be construed as professional financial advice. Stock market investing involves risk of loss.
Sources: Price-to-earnings ratio (SEC Investor.gov glossary) (https://www.investor.gov/introduction-investing/investing-basics/glossary/price-earnings-pe-ratio) · How to read a company's 10-K (SEC Investor.gov) (https://www.investor.gov/introduction-investing/investing-basics/glossary/10-k)