
Add up the last four quarters of 3M’s diluted earnings and you get $1.78 plus $1.23 plus $1.07 plus $1.55, which is $5.63. Divide that into the $165.89 share price and the answer is 29.5. That is the whole mystery of a stock that looks 29.5 times earnings against a five-year average of 12.5.
The multiple did not double because investors got greedy. It doubled because the denominator was cut nearly in half. Fiscal 2022 diluted EPS was $10.18. The trailing figure is now $5.63, a drop of 45%. Our reading is that 3M is priced on the earnings it is expected to have next year, and the trailing P/E is a record of the year it just had.
Where the five-year average comes from
A five-year average is only as good as the earnings underneath it. The database’s monthly P/E series for 3M shows 11.8 at the end of 2022 and 10.7 at the end of 2023, the two years that pull the average down to 12.5. In both, 3M was carrying a large earnings base that has since left the building. The 2024 figure in that series is zero, which is how the data flags a period with no meaningful trailing multiple.
The table shows why. Fiscal 2023 is a loss of $12.63 a share, with a net loss near $7.0 billion and an operating loss of $10.7 billion. We do not know from the database what drove that year, and the news feed does not say, so we treat it as a one-time break and not a trend. What matters is that it separates two different companies.
| Metric | Value | Context |
|---|---|---|
| Price (approx.) | $165.89 | 52-week range $138 to $184 |
| P/E (TTM) | 29.5x | Five-year average 12.5x |
| Price-to-sales | 3.4x | Five-year average 2.1x |
| Analyst ratings | 45% buy, 36% hold | 11 analysts; average target $185 |
| Dividend yield | 1.82% |
Read the revenue column with care. It drops 26% between 2021 and 2022, from $35.36 billion to $26.16 billion, and the years after that are nearly flat. A step that clean reads as a change in what the database counts, not as a real one-year collapse. Our earlier note on the stock pointed to the 2024 spin-off of the health care business as the likely reason, and we would treat that as approximate. We would not compare 2021 revenue to anything later. From fiscal 2023 on, the base looks like the current company: $24.6 billion in 2023, $24.6 billion in 2024 and $24.9 billion in 2025.
Earnings fell four times before they rose
The quarterly diluted EPS line carries the recent story. The June quarter was $1.78, up 32.8% from $1.34 a year earlier. Before that came four straight year-over-year declines: 35.3%, 37.5%, 19.5% and 39.7% in the quarters running through March. Only in June did the comparison turn positive.
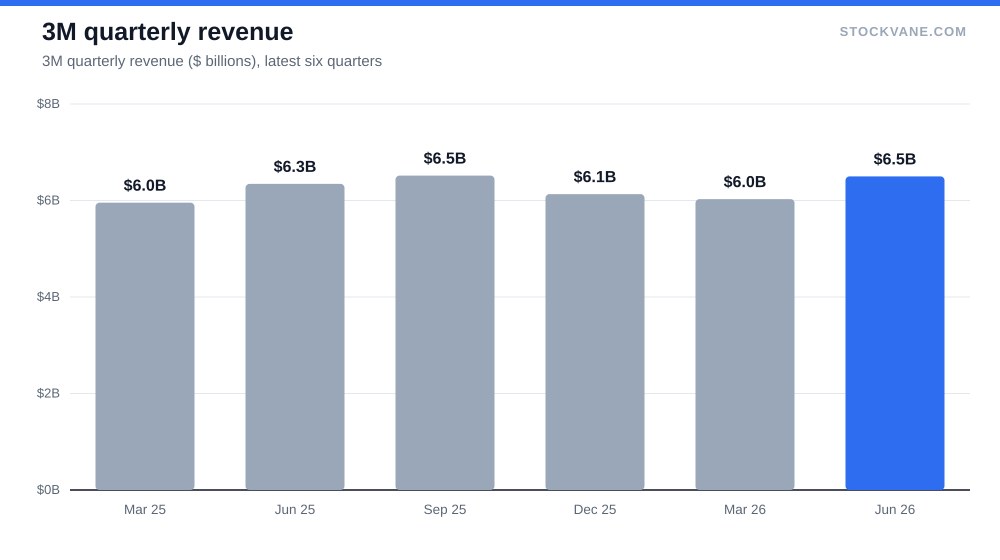
Revenue is not the source of the swing. June-quarter sales were $6.5 billion, up 2.5% from a year before, inside a range of -1.0% to +3.5% over the last eight quarters. Growth is slow and steady, so nearly all of the earnings movement comes from margins and one-time items, not from demand.
When earnings shrink and the price holds, the multiple rises without anyone paying more for the business. That is exactly what happened. The stock is 9.9% below its 52-week high of $184 and 20% above the low of $138. The monthly closes in our price database show $85.50 at the end of 2023 and $165.89 now, a gain of about 94%. The price roughly doubled while trailing EPS went from a loss to $5.63.
Does that make the stock expensive? Not automatically. A trailing multiple compares the price with a year that already ended. Investors are paying for what comes next.
Margins tell a related story. Gross margin slipped to 39.9% in fiscal 2025 from 41.2% the year before, and net income fell to $3.3 billion from $4.2 billion, a decline of about 22% on revenue that rose 2%. Operating profit of $4.8 billion was a margin of 19%. A business with flat sales and shrinking net income is either absorbing costs it can pass on later or losing pricing power, and the database cannot tell us which. That is the argument the next few reports have to settle.
The 18.7 forward multiple and the 57% assumption
The forward P/E is 18.7. It is built on consensus forward EPS of $8.85, which is 57% above the trailing $5.63. That is a large step, and the growth is not spread across a year of visible reports. It is a forecast.
Two cautions. First, the consensus figure is probably an adjusted number and the trailing figure is GAAP, so the 57% partly compares two different definitions of profit. We cannot confirm that from the database, which is why we call it likely and not certain. Second, even on the forward number the stock is not cheap next to its history. Price to sales is 3.4 against a five-year average of 2.1, and price to book is 29.0 against 11.6. The book value comparison is unreliable after a $7 billion loss year, so we lean on sales. On sales the market is paying about 60% more than its own five-year norm.
For a sense of how this sits against other stocks that have looked stretched, see our look at Costco at 50 times earnings, where the multiple is high because the business is priced for durability. 3M is different: its multiple is high because earnings dipped, and the question is whether they recover. On the other side, JPMorgan at 15 times shows what a market pays for a business at a record with a steady earnings line.
There is a fair objection to all of this: markets look forward, so why does a trailing multiple deserve any attention? It deserves attention because it is the only version of the number that has already happened. The forward figure is somebody’s estimate, revised as the year goes, and estimates for a company coming off a loss year have a wide error band. A holder who buys at 29.5 times trailing is not wrong to think about the cushion. If the recovery arrives, the trailing figure corrects itself. If it stalls, nothing else in the valuation stands in for it.
The dividend that was reset
The dividend history is part of the answer. Dividends per share were $5.92 in 2021, $5.96 in 2022 and $6.00 in 2023. Then $3.61 in 2024 and $2.92 in 2025. Cash dividends paid fell from $3.31 billion in 2023 to $1.56 billion in 2025. The quarterly payment is now $0.78, up from $0.73 in the prior year and $0.70 before that, so the new, lower dividend is being raised again.
At $3.02 paid over the last twelve months, the yield is 1.82%. On the trailing EPS that is a payout of about 54%, and on the forward EPS it is closer to 34%. The database does not say why the dividend was reset, so we will not guess at a motive. What it does show is a payout now well under the roughly 100% that $6.00 represented against a normal year of earnings, which leaves room for raises. Income buyers who remember $6.00 will find $2.92 hard to look at. That is fair.
What the Street and the flow data say
Eleven analysts cover the stock, and 45% rate it a buy, 36% hold and 18% sell. The average target of $185 sits 11% above the price, with a range from $132 (-20% from here) to $218 (+31%). That is a wide spread, and the low end is below the current price. Citi kept its Hold with a $183 target on September 11.
Earnings-day moves have averaged about 6.0% in the database, and the last report on 2026-07-21 gave +7.3%. Short interest is 1.8% of float, which is low. Our quant grade is a C, up from a D earlier, a small improvement that tells us the market is no longer punishing the stock.
What would make this call wrong
The bear case is simple: forward EPS never arrives. If the $8.85 consensus drifts toward the $6.00 of fiscal 2025, the forward multiple climbs toward 28 and the entire premium rests on a forecast that did not come true.
The bull case is equally direct. If earnings are recovering, the trailing multiple is misleading in the way it was misleading on the way up, and 29.5 will compress toward the high teens simply as the reported quarters roll forward. For readers who want the mechanics of how to check a print against consensus, our guide to reading an earnings report covers it.
We are not covering the legal cost side of 3M here, the composition of its segments after the spin-off, or its cash flow in detail. The database’s cash flow line shows operating cash flow of $2.31 billion in 2025, well below $6.68 billion in 2023, and we cannot explain the gap from these data. That is a question for a reader who wants to go further.
The quarterly figure that carries 18.7
The number to hold 3M to is not the annual forecast. Consensus of $8.85 implies about $2.21 a quarter. The June quarter delivered $1.78, so the average quarter has to run 24% higher than the best of the last four. If the September and December reports come in near $2.00 and show a path to $2.21, the forward P/E is credible. If they land near $1.80, the trailing multiple will fall only slowly, and 18.7 will look like an optimistic number.
Financial disclaimer: The content on StockVane is for educational and informational purposes only and should not be construed as professional financial advice. Stock market investing involves risk of loss.
Sources: Dividends (SEC Investor.gov glossary) (https://www.investor.gov/introduction-investing/investing-basics/glossary/dividend) · Dividends tax topic (IRS) (https://www.irs.gov/taxtopics/tc404)