
Duke Energy has raised its quarterly dividend by exactly two cents every year since 2023. It paid $1.025 in the quarters through May 2024, $1.045 a year later, $1.065 after that, and $1.085 with the August 2026 payment. Nobody tunes a schedule that regular by looking at earnings, and earnings are where this company has been anything but regular.
Diluted EPS went from $4.94 in 2021 to $3.17 in 2022, a 36% drop, then to $5.71 in 2024. Over the same years the dividend per share went from $3.90 to $3.98 to $4.14. It never noticed. We think that is the thesis of the whole stock: Duke Energy sells a dividend that is decoupled from its own earnings, and the price at $118 asks whether the balance sheet can keep funding that promise at 3.62% a year.
What a regulated utility actually promises
Duke serves electric and gas customers across the Carolinas, Florida, Indiana, Ohio and Kentucky. The latest quarterly segment split in the database shows electric utilities at about 94.5% of revenue and gas at 5.9%, with small negative eliminations. That is a one-product company, and the product is regulated. Regulators set what Duke may earn on the assets it builds, so revenue tracks how much it invests, not how many customers it wins from a rival.
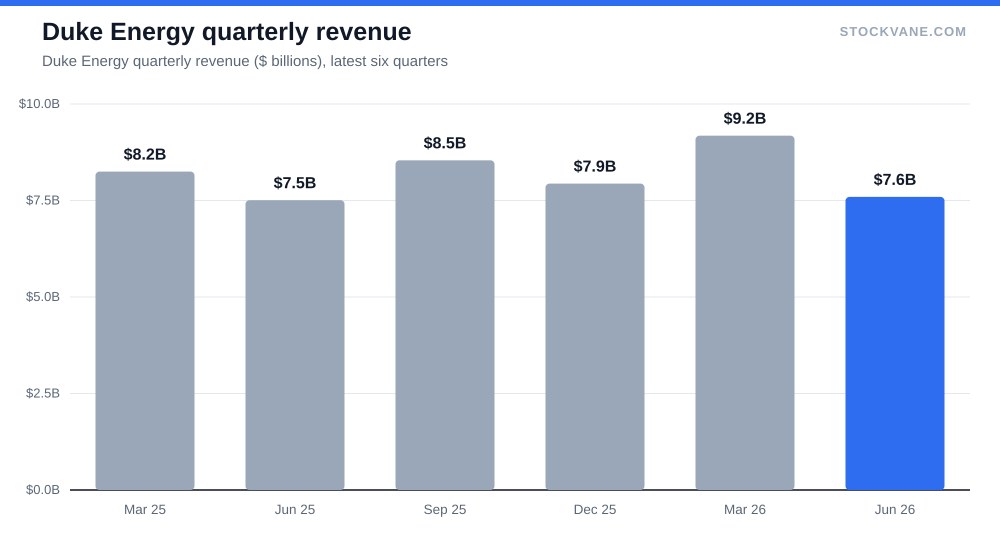
Growth is therefore a function of capital spending. Fiscal 2025 revenue was $32.2 billion, up 6% from $30.4 billion, and operating profit reached $8.6 billion. The database’s gross margin rose to 51.2% from 50.1% the year before. Nothing there looks like a company scrambling; it looks like an asset base compounding inside a rate framework.
Compare that with a pipeline partnership. Energy Transfer yields 6.32% against Duke’s 3.62%, and its diluted EPS slipped 5% in fiscal 2025 while Duke’s rose 11%. The higher yield comes with an earnings line that moves with commodity volumes. Duke’s payout costs less and, on the record, moves less.
Two cents a year against a swinging EPS line
The dividend record is the proof of design. Dividends per share climbed from $3.90 in 2021 to $4.22 in 2025, a compound rate of 2.0% a year. Diluted EPS over the same span went $4.94, $3.17, $3.54, $5.71, $6.31. Payout measured on that EPS ran 79% in 2021, 126% in 2022, 115% in 2023, 73% in 2024 and 67% in 2025.
A payout of 126% means Duke paid out more than it earned in 2022, and the board still added eight cents for the year. I read that as the design working as intended: the dividend follows a multi-year view of regulated earnings power, not the last four quarters. It also means the 2025 payout of 67% is the most comfortable reading of the five years, the first time the board has not had to defend a dividend that outran earnings.
On the trailing figures the story is similar. The snapshot lists a trailing EPS of $6.66 and a dividend of $4.26, for a payout near 64%. The four latest declared payments add up to $4.28.
The part that is not boring: who pays for the buildout
Now the counter-case, and it is a real one. Here are the cash flows behind that steady dividend.
| Metric | Value | Context |
|---|---|---|
| Price (approx.) | $117.53 | 52-week range $111 to $132 |
| P/E (TTM) | 17.6x | Five-year average 26.5x |
| Price-to-sales | 2.8x | Five-year average 2.9x |
| Analyst ratings | 57% buy, 43% hold | 14 analysts; average target $137 |
| Dividend yield | 3.62% |
Capital spending exceeded operating cash flow in four of the five years. In 2024 the two nearly matched, with $0.05 billion to spare. In fiscal 2025, Duke generated $12.33 billion from operations and spent $14.02 billion on capital, leaving a hole of $1.69 billion before a single dividend dollar left the building. Add the $3.30 billion of dividends and the outside funding need was about $5.0 billion.
Across the five years the pattern adds up. Free cash flow, defined here as operating cash flow less capital spending, totaled $-11.2 billion. Dividends paid totaled $16.0 billion. Together, that is roughly $27 billion that came from lenders and shareholders instead of from operations. Long-term debt and lease obligations rose from $61.4 billion to $81.1 billion over the same span, an increase of $19.8 billion.
That is how a regulated utility grows. It borrows to build, the regulator lets it earn a return on what it built, and the return arrives later through rates. The dividend is not being paid from free cash. It is being paid from a permanent financing arrangement. This is fine while borrowing is available at a tolerable price and regulators keep approving the returns.
The price of borrowing is the concrete test. Interest expense in the database rose from $2.21 billion in 2021 to $3.63 billion in 2025, up 64%. Operating profit rose from $5.84 billion to $8.6 billion, a gain of $2.74 billion. Interest took about $1.42 billion of that gain, roughly half. Earnings did grow. But a large share of what looks like growth is being handed to bondholders.
What the price says
At $117.53, the stock is 11.1% below its 52-week high of $132 and 6% above the low of $111. Trailing P/E is 17.6, forward P/E is 17.8, and the database’s industry average forward multiple is 16.5, so Duke carries a modest premium to its group.
The comparison to Duke’s own history looks far more dramatic: a five-year average P/E of 26.5, and a current reading at the 0th percentile of its own range. I would not lean on that. The five-year window includes 2020 and 2022, when diluted EPS was $1.72 and $3.17, and dividing a normal share price by a depressed EPS produces inflated multiples. The average is the distortion, not the discount.
Analysts sit at $137 on average, 17% above the price, with a range of $127 to $146. Of 14 analysts, 57% say buy and the rest hold, none sell. The news feed’s latest item, dated August 7, has KeyBanc keeping its buy rating with a $139 target. Short interest is 2.2% of float, a very low reading.
Our own quant grade is a D with a score of 30, down from a C at 65 in mid-September. It is a momentum-and-valuation composite and it treats a stock 11% off its high with a forward EPS estimate of $6.59 (implying -1% growth against trailing) as unexciting. For a holder who wants a dividend, unexciting is the specification.
Where the framework could fail
Three conditions would make us wrong.
The first is rates. A utility carrying $81 billion of long-term debt is exposed to the cost of refinancing it. A move in bond yields matters more to Duke than any quarter of weather. The Fed’s September hike is the kind of event that moves the whole group in a day.
The second is regulators. Duke’s earned return is a permission slip issued state by state. A commission that trims allowed returns or delays recovery of spending leaves the borrowing and shrinks the payback. Our database does not carry rate-case outcomes, so we cannot say how close any decision is, and we are not trying to forecast one here.
The third is a second bad earnings year. The 2022 payout of 126% was survivable because earnings snapped back to $5.71 two years later. If EPS fell below the $4.22 dividend again and stayed there, the two-cent habit would be the first thing questioned, and the interest bill would make it harder to defend.
Duke’s price also depends on a peer set. Utilities are bought as a group, and when investors want safety the whole sector re-rates together, which is why a stock can fall 11% from its high with no change in its own fundamentals. That cuts both ways for a holder: the entry point is decent, but the multiple is not something Duke controls.
How this fits with other utilities and income choices
Anyone comparing Duke to a growth-oriented utility should read our piece on NextEra and the electricity demand boom, which argues about the same demand story from the other side of the group. For whether to chase a yield like this one or a faster-growing payout, see the comparison of high yield against dividend growth. Duke sits firmly on the yield side: about 2% a year of dividend growth, a 3.62% starting yield, and total return that leans on the price holding.
We are not covering a full discounted-cash-flow model or a state-by-state view of the rate base here. The cash flow table is the piece of Duke that a yield screen will never show you, and it is the reason a 2% raise can be both very safe and very expensive.
The August 2027 raise
Our test is simple. If the August 2027 payment comes in at $1.105, the pattern holds and the two-cent schedule is intact. If it comes in at a penny or not at all, the board has told us the balance sheet is speaking. Before that, watch fiscal 2026 capital spending against operating cash flow: a gap wider than the $1.69 billion of 2025 would push the funding need above $5 billion, and the debt line would carry that.
Financial disclaimer: The content on StockVane is for educational and informational purposes only and should not be construed as professional financial advice. Stock market investing involves risk of loss.
Sources: Dividends (SEC Investor.gov glossary) (https://www.investor.gov/introduction-investing/investing-basics/glossary/dividend) · Dividends tax topic (IRS) (https://www.irs.gov/taxtopics/tc404)