
Welcome to the Stock Quant Rating Tool
I’m going to be honest with you about how this thing got built, because I think the backstory is more useful than a features list.
I got tired of opening six different tabs every time I wanted a gut-check on a stock, one for the analyst ratings, one for the chart, one for the balance sheet, one for whatever forum was currently arguing about whether Tesla’s P/E made any sense. So I built something that pulls the twenty-two numbers that actually matter – if you’d rather filter across the whole market first and only then pull up individual ratings, the stock screener roundup covers that side of the workflow. into one score, updates it live, and lets you argue with it instead of arguing with six browser tabs.
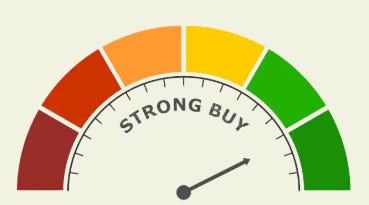
It’s not going to replace your judgment. It’s going to make your judgment faster to exercise, which honestly might be more dangerous, so use it accordingly.
What you’re looking at
The eight cards up top are always on, S&P 500 and the Magnificent Seven, scored the second the page loads. That’s your baseline, your “what’s the market doing today” glance before you even think about typing a ticker.
Below that, the search bar takes tickers or company names. Yes, you can just type “Disney” instead of digging up DIS. We built that in specifically because half of you were going to Google “Disney stock ticker” first anyway, and that’s a wasted click we can save you.
Two things worth knowing that aren’t explained on the page itself
The score updates live every time you load it, and that’s intentional, not a bug you’re imagining. Come back tomorrow, the number might’ve moved a point. That’s the market doing market things, not the tool being inconsistent. If NVDA scores a 7.2 today and a 6.8 next week, that’s information, not noise, something in the underlying 22 factors actually shifted.
Weights are yours to break. Most people will never touch the “Customize Category Weights” button, and that’s fine, the default even split is a reasonable starting point. But if you’re the type who thinks valuation matters more than momentum, or you flat-out don’t care about dividend yield, drag those numbers around. The score recalculates on the fly. Nobody’s grading you on how you weight it, this is your model now, not ours.
Why I’m asking you to share this instead of just use it quietly
Every stock tool on the internet either hides its methodology behind a paywall or doesn’t have one worth hiding. This one shows you every input, every formula, every number that went into the score, right there on the page. If you think that’s a refreshing change of pace from “trust me bro, 8.5/10, buy,” forward it to whoever you argue about stocks with in your group chat. Let them try to break the rating on their favorite meme stock. I’d like to know what happens.
Financial Disclaimer: The content on StockVane is for educational and informational purposes only and should not be construed as professional financial advice. Stock market investing involves risk of loss.
Pingback: Top 5 Stocks to Buy for September 2026: A Win-Rate-First Portfolio – StockVane
Pingback: StockVane’s Newly Analysis Tool Lets Investors Set Their Own Scoring Rules – StockVane