
Six subscriptions. About $1,456 a year, before anyone upgrades to the tier they actually end up using. That is roughly what it costs me to run six different stock research platforms at once, and someone asked me last month which one I would keep if I could only keep one. I could not give a clean answer. Each one does a job the other five do not, so the real question was never which one is best. It is which five I would drop first if the budget forced my hand.
This is not a sponsored list, and nobody is paying me to rank one of these ahead of another. I hold a paid subscription to all six and check most of them weekly. I have canceled and rejoined two of them over the years as my own process changed. What follows is what actually happened when I used each one on a real decision, not a rewrite of six pricing pages.
What the six actually cost, at a glance
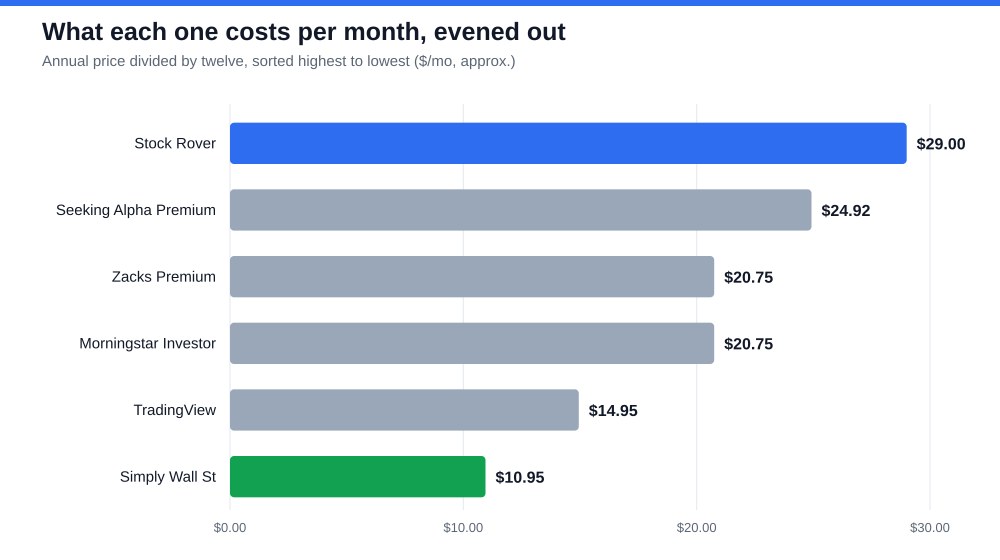
Six tools, six different jobs, and pricing that spreads out more than most beginners expect. Here is the shape of the field before the individual write-ups.
| Tool | What It’s Really Built For | Annual Cost (Approx.) |
|---|---|---|
| Seeking Alpha Premium | Crowdsourced analysis plus a quant score layered on top | $299/yr |
| Zacks Premium | A single, decades-old quant ranking system with a public track record | $249/yr |
| Simply Wall St | Visual, 30-second snapshots of valuation, health and growth | $131 to $258/yr depending on tier |
| Stock Rover | Custom screening across 800-plus metrics, and real portfolio analytics | $348/yr |
| Morningstar Investor | Analyst-driven fair value and moat ratings, strong for funds and ETFs | ~$249/yr, often discounted |
| TradingView | Charting first, with screening and alerts layered around it | $180 to $720/yr depending on tier |
Now the part that actually matters: what each one is like to use on a Tuesday morning when a position is down 4% and you need an answer fast, not a features page.
How I decide whether a subscription earns its renewal
The bar I hold each one to isn’t “does it have a lot of features.” Every platform on this list has an impressive features page. The question I ask when a renewal notice hits my inbox is narrower: did this tool change a real decision I made this year, or did I just get comfortable with the habit of opening it? That question has cost me two subscriptions that looked strong on paper and quietly weren’t earning their keep.
The other thing I check is overlap. If two tools on my list answer the same question in different packaging, one of them is dead weight. Cancel it before you renew out of routine.
Seeking Alpha Premium: the one I have used longest
I have had a running subscription here since before Quant Ratings became the centerpiece of the product, built from over a hundred fundamental and technical factors and updated daily. It is the fastest second opinion I know before reading a word of analysis, and it is the same instinct behind StockVane’s own Quant Rating on a page like Microsoft’s: a rule-based read before the prose starts. Pair the score with portfolio tracking, which flags a holding the moment its grade slides toward Sell, and you get an early-warning system. I got a downgrade alert on a position I had been holding on conviction alone, checked the factors behind it, and trimmed two weeks before the next earnings report confirmed exactly what the score had flagged.
Where it wears on me is the volume of contributor content. Quality swings with who is writing, theses go stale within weeks, and reconciling five authors’ opinions on one ticker is unpaid work the platform hands you rather than does for you. I still keep Premium. I stopped expecting it to hand me a conclusion.
Zacks Premium: narrow, dated, and still worth the login
Zacks doesn’t get talked about with the same energy as the newer platforms, partly because the interface looks untouched in a decade. The Zacks Rank has a published track record stretching back further than almost anything else here, and the earnings estimate revision data underneath it is some of the cleanest revision tracking I have found.
The honest downside beyond the dated screen is depth. Once you have pulled the Rank and checked the revision trend, there isn’t much pulling you back the way Stock Rover or Seeking Alpha’s article library does. I use it as a fast, narrow confirmation, not a place I browse.
Simply Wall St: what I hand a first-time investor
If a friend just opened a brokerage account and doesn’t know where to start evaluating a stock, this is what I point them to before anything else. The snowflake, which scores a company across valuation, future growth, past performance, financial health and dividends as one five-point shape, compresses a wall of data into something readable in under a minute. For someone who doesn’t yet know what a PEG ratio is, that isn’t a gimmick. It’s the on-ramp they actually need.
The limit shows up fast once you outgrow the beginner stage. Report depth is metered by tier, and once you’ve internalized the shape, there isn’t much analytical horsepower underneath it. I don’t use it for my own decisions anymore. I keep the subscription because it’s still the best answer I have when someone asks where to start.
Stock Rover: where I actually build my screens
This is the one I spend the most working hours inside, and it isn’t close. Stock Rover gives you upwards of 800 screening metrics and freeform custom formulas, with percentile ranking against sector peers built in. It also carries up to twenty years of historical fundamentals to test a screen against, instead of eyeballing today’s snapshot alone. When I want to know whether a valuation looks cheap against the stock’s own history, not just the sector average today, this is the only tool here built to answer that.
It is also the priciest subscription I carry, and it’s worth saying why. Nobody inside Stock Rover writes you a story about a company. You get the numbers a story would be built from, and building it takes real time. My own workflow runs three saved screens most weekends: quality compounders trading below their five-year average multiple, margin expansion alongside decelerating revenue as an early warning, and a watchlist check for anything that has crossed a valuation line I set months earlier. If you want a conclusion handed to you, this isn’t your tool. If you want to check someone else’s conclusion before trusting it with your money, it’s the best one I own.
Morningstar Investor: built for funds, not fast movers
Morningstar earns its keep for one job: a disciplined, analyst-driven fair value estimate paired with a qualitative moat rating that tries to capture whether an edge is durable, not just currently profitable. I lean on it for fund and ETF research more than single stocks, since the fund screener and portfolio X-ray sit above what the other five offer in that category. The X-ray has caught overlap in my own holdings more than once, showing two ETFs I’d bought for different reasons carrying nearly identical top-ten positions.
Where I want more is speed on smaller or faster-moving names. The analyst model that makes the fair value numbers trustworthy also means slower coverage updates, and if you trade outside large and mid-cap names with active coverage, you will feel that gap.
TradingView: charting first, pricier this year
TradingView didn’t start as a fundamentals platform. It started as charting software, and that shows in how the product is organized. The screener has gotten capable over the past couple of years, and building a technical and fundamental screen without leaving the charting window saves real time during a busy week.
Pricing is the thing I’d flag loudest, because TradingView raised every paid tier by roughly 17 to 20 percent this spring, and the plan most active users land on now runs meaningfully higher than a year ago. I stayed on Plus through the increase out of inertia, then actually audited how many higher-tier features I used and found I had never once touched the volume footprint tools Premium adds. Downgrading cost me nothing in research quality and saved real money over a year. If charting sits at the center of your process, it’s still worth it. If you’d mainly be paying for the screener, comparable fundamental screening exists for less elsewhere on this list.
What each tier actually costs once you add it up
The sticker prices above are only part of the story. The real number depends on which tier you need, and that’s where people overspend without noticing.
| Tool | Entry Tier | Where Most Serious Users Actually Land |
|---|---|---|
| Seeking Alpha | Premium, $299/yr | Premium is enough for nearly everyone; Pro is built for professional research teams |
| Zacks | Premium, roughly $249/yr | Premium covers what most individual investors need |
| Simply Wall St | Premium, about $10.95/mo | Premium; Unlimited is only worth it if you’re checking dozens of tickers weekly |
| Stock Rover | Premium, $348/yr | Premium is effectively the only tier worth buying for screening depth |
| Morningstar Investor | Investor, roughly $249/yr | The single tier available; watch for seasonal discounts before renewing |
| TradingView | Essential, $14.95/mo | Plus or Premium, depending on how many alerts and charts you actually run |
Every figure above is what each provider listed publicly at the time of writing. Pricing on software like this moves more often than the marketing page admits, so check the provider’s own site before you subscribe rather than trusting any review, including this one.
If you are just starting out, buy one tool, not six
I get some version of this question constantly, so here is a straight answer instead of “it depends.” For a true beginner, someone who has never run a screen and doesn’t yet have opinions about which metrics matter, start with Simply Wall St alone. It’s the cheapest entry point here, the visual format keeps you out of a spreadsheet before you have the vocabulary to read one, and it teaches what valuation and financial health mean faster than a chapter on ratios would. You don’t need six subscriptions in year one. You need one you’ll actually open.
Once you have six months to a year of looking at real companies behind you, add Seeking Alpha Premium. The quant score gives you a second opinion to check your own thinking against, and reading the article library critically is useful exposure to how experienced investors argue a case. I would not start there. I would graduate there. What I’d skip for now is Stock Rover, not because it’s weak, it’s the one I personally use most, but because 800 metrics is a lot of toolkit if you don’t yet know which dozen matter for your own strategy. A proper screener comparison is worth reading once you’re ready for that step, since screening tools split on more than price.
The mistake I see most often
The single most common misuse, in reader emails and in my own early years doing this, is treating any one of these six scores as a final answer instead of an input. A quant rating, a snowflake, a moat rating, a Zacks Rank: none of them were built to be the only check before sizing a position, and every provider here says so in their own methodology pages if you read closely. They exist to narrow a universe of thousands down to a shortlist worth your attention, not to replace the judgment you apply once you’re on it.
The second mistake is subscription creep without a process behind it. It’s easy to accumulate four or five of these over a couple of years, each one added because a specific situation called for it. Almost nobody goes back to retire the ones that stopped earning their keep. That is the real risk in a piece like this one: paying for six opinions and actually trusting none of them. I would rather run a disciplined process on two well-chosen tools than pay for six and meaningfully use one out of habit.
The TradingView price I would not pay above
If you forced me to answer the question that started this piece, which one I’d keep if I could keep only one, I would say Seeking Alpha Premium, because a decent quant score paired with a searchable article library covers the widest range of situations for $299 a year. I’d give you that answer with real hesitation, though, because the six tools above aren’t competing with each other so much as covering six different gaps in one process, and $1,456 a year is smaller than the cost of one bad position sized on incomplete information.
For a fast, free first pass built around the factors I actually check before opening any of the six, valuation, momentum and estimate revisions folded into one score, the StockVane Rating Tool does that job at no cost. My own ceiling is the TradingView renewal: if Plus crosses $300 a year at my next billing cycle, I downgrade to Essential without a second thought, because the screener alone was never worth that much to me.
Gavin Thorne has invested in U.S. stocks for six years and previously worked at a large publicly traded internet company. He writes about income-oriented strategies, including cash-secured puts, and about how he reads company data. This article reflects his personal research process and is for informational purposes only. It does not constitute investment advice.
Sources: Dividends (SEC Investor.gov glossary) (https://www.investor.gov/introduction-investing/investing-basics/glossary/dividend) · Dividends tax topic (IRS) (https://www.irs.gov/taxtopics/tc404)