
Tuesday night, I made a coffee I didn’t need and sat down to build what I was sure would be the perfect stock screen. Market cap above a billion. Trailing P/E under 15. Revenue growth above 20 percent. Debt to equity under 0.3. Relative strength between 40 and 60. Dividend yield above 2 percent. I kept stacking filters like sandbags against a bad trade, and the screener handed back nothing. Not a short list. Zero names. I had just described a company that doesn’t exist.
Nobody tells beginners this part: more filters don’t make a better list. Past a certain point they make no list at all, and a screener is only ever as useful as the judgment behind what you filtered for in the first place. A stock screener is a subtraction tool. It is not an addition tool, and every retail investor who treats it as one eventually stares at an empty results page wondering what went wrong.
Since that Tuesday I’ve spent an unreasonable number of evenings testing most of the screening products a retail account can actually reach. Here’s what the category gets wrong: the two tools I still open every week, and how few filters it actually takes to make a list disappear.
Why “stock screener” describes three different products
“Stock screener” isn’t one category. It’s at least three, sold under the same word. Part of the confusion beginners feel comes from comparing tools that were never built to answer the same question. Technical scanners are built for active traders chasing intraday setups: real-time price action, volume spikes, chart-pattern recognition. Fundamental screeners are built for someone cutting a list of fifty companies down to five, using balance-sheet and income-statement fields most technical traders never open. Hybrid rating sites blend both and hand you one opinionated score instead of the numbers underneath it.
Most comparison guides, including the best stock research tools roundup, treat all three as interchangeable and rank them on a single list. That’s roughly like ranking a stethoscope against a thermometer because both live in the same bag. Each tool answers a different question. The mistake I see beginners make first isn’t picking the wrong screener. It’s not knowing which question they’re asking.
| Screener type | Built for | Example tool | Where it breaks |
|---|---|---|---|
| Technical scanner | Active traders chasing intraday price action | TradingView custom scans | Chokes on thin volume, throws false breakouts |
| Fundamental screener | Cutting a broad list down by balance-sheet and income-statement fields | Finviz free screener | Runs on quarterly data that can sit stale for weeks |
| Hybrid rating tool | A single blended score standing in for the numbers underneath it | Moomoo’s built-in stock score | Invites you to stop asking what’s underneath the number |
That’s the split, and below is roughly how each type spends your time, and what breaks if you lean on it alone. Two of those three are what I actually use, and I built distinctly different habits around each one.
The two I actually open every week
I use Finviz for the first pass and TradingView for the second, and the order matters more than either tool does on its own. Finviz’s free screener covers roughly seventy fundamental and technical fields, enough to run the market-cap-and-valuation cut I do most mornings before the open. The free tier is blunt about its limits: no backtesting, limited price history, an interface that looks like it stopped changing years ago. It still does the one job I need from it, fast, turning eight thousand tickers into forty in under a minute.
TradingView is where those forty become something I’d actually trade. Custom Pine Script conditions let me layer price action, relative strength against a sector, and volume confirmation on top of whatever Finviz already narrowed down, and the charting is simply better than anything a pure fundamental screener offers. What it doesn’t do well is deep balance-sheet work. For that I still cross-check names against a service built for research rather than charting, which is the gap the Seeking Alpha review on this site covers if you’re weighing whether a paid research subscription earns its keep. A hybrid rating tool like Moomoo’s built-in scoring sits in between the two: useful as a sanity check, thinner as the only screen you run.
None of that is a universal recommendation. It’s what survived after I tried the alternatives and kept coming back to two of them out of habit, which is a more honest endorsement than most comparison articles offer.
Saved screens matter more than either tool’s marketing admits. I keep four running on Finviz, updated weekly instead of rebuilt from scratch, because a filter set I re-type every Monday morning is a filter set I’ll eventually get lazy about and loosen without noticing. TradingView’s alerts do the opposite job well: instead of a list I have to remember to check, a breakout condition or a volume spike pings me, and I decide in the moment whether it’s worth acting on. The habit of saving a screen rather than rebuilding it is a small thing. It’s also the difference between a tool you actually use in six months and one you paid for once and forgot.
The filter-stacking trap
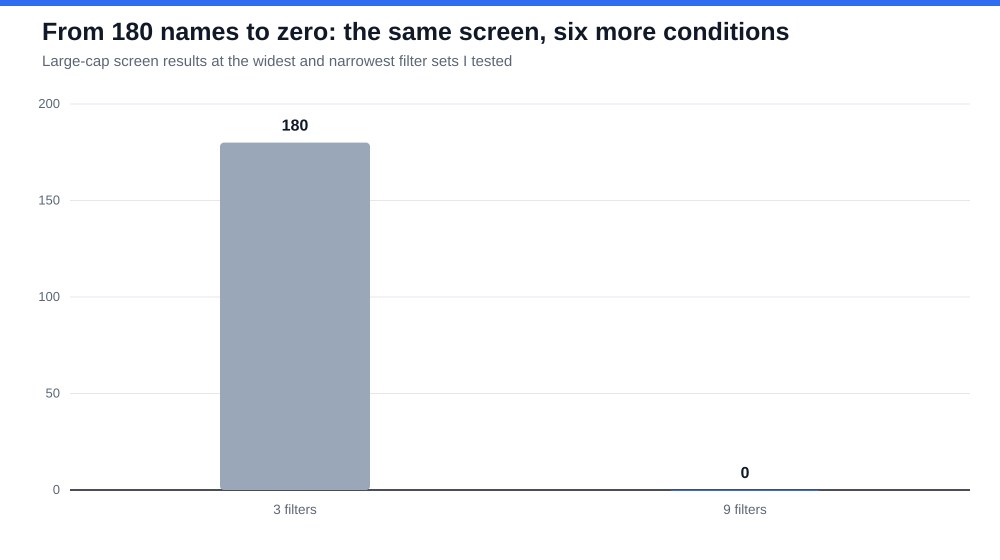
Here’s the part that Tuesday night taught me, and it holds up every time I rebuild the test. I ran the same large-cap screen on Finviz with a rising number of conditions stacked on top of each other, from three filters to nine, and wrote down how many names survived each pass.
Three broad filters, market cap, sector, and a P/E ceiling, still left roughly 180 names, plenty to actually read through in an afternoon. Five filters cut that to about 40. Seven filters, adding a growth and a margin threshold, left six names standing. Nine filters, the full wish list I started with that Tuesday, left zero. Each additional condition wasn’t making the list smarter. It was excluding good companies for failing one arbitrary threshold, the same way a single weak paragraph in a filing can sink a company in your head if you’re grading pass-or-fail instead of reading what’s actually there.
The lesson isn’t to use fewer filters on principle. It’s to stop trusting a filter you can’t defend out loud. If I can’t explain in one sentence why revenue growth needs to clear 20 percent rather than 15, that filter is doing more harm than the names it removes are worth.
What the marketing pages leave out
Every screener’s landing page shows you the same demo: type in three conditions, watch a clean list appear, imagine the money. None of them show you the failure modes. Fundamental screeners run on quarterly data that can sit stale for weeks after a report drops, so a screen built around “beat estimates last quarter” can miss a company for a month after the number actually changed. Technical scanners choke on thin volume; a small-cap name can trip a breakout filter on one large trade that says nothing about real demand. Hybrid scores are the worst offender for hiding this, because a single number invites you to stop asking what’s underneath it.
I’ve made that mistake myself, chasing a name a hybrid score flagged without checking whether the underlying fundamentals and the underlying price action actually agreed with each other. The Tesla mistakes piece on this site catalogs a version of the same error, trusting one signal past the point where it was still telling you anything true. A screener has the same blind spot. It hands you a list with total confidence and zero context, and the context is the part you’re actually being paid to bring yourself.
Two screens I’d actually run this week
If I were starting from zero today, I’d build two, not one. A value screen: market cap above 2 billion, trailing P/E below the sector median, debt to equity under 1, free cash flow positive for at least three straight years. That combination is loose enough to return a workable list, usually somewhere between 30 and 80 names depending on the week, and tight enough to mean something.
A separate momentum screen: price above both the 50-day and 200-day moving average, relative strength stronger than the sector, average volume above a floor that rules out anything too thin to trade cleanly. I keep the two lists apart on purpose. The moment a name shows up on both, that’s the one I actually read a filing on, and it happens rarely enough that when it does, I pay attention.
Run either screen weekly rather than once. A name that fails a value screen in January and clears it by April usually cleared it for a real reason, a cheaper price, a better quarter, not because you finally found the right filter setting.
Size the output before you size the position. A value screen returning 30 names on a slow week and 80 on a volatile one isn’t broken. It’s telling you something about how many companies the market repriced that week, and treating both weeks the same, buying the same number of names off either list, ignores information the screen just handed you for free. I read the count first now, before I ever open an individual result.
The number to check on your own screen
None of this replaces reading the filing. It just tells you which filing to read first. The number I’d watch isn’t how many names come back. It’s how many filters it took to get there. Past six or seven conditions on a broad universe, you’re not screening anymore. You’re describing a company that doesn’t exist and hoping the market happened to build one to match.
Financial disclaimer: The content on StockVane is for educational and informational purposes only and should not be construed as professional financial advice. Stock market investing involves risk of loss.
Sources: Dividends (SEC Investor.gov glossary) (https://www.investor.gov/introduction-investing/investing-basics/glossary/dividend) · Dividends tax topic (IRS) (https://www.irs.gov/taxtopics/tc404)