Let me tell you what happened the first time I opened moomoo’s charting interface.
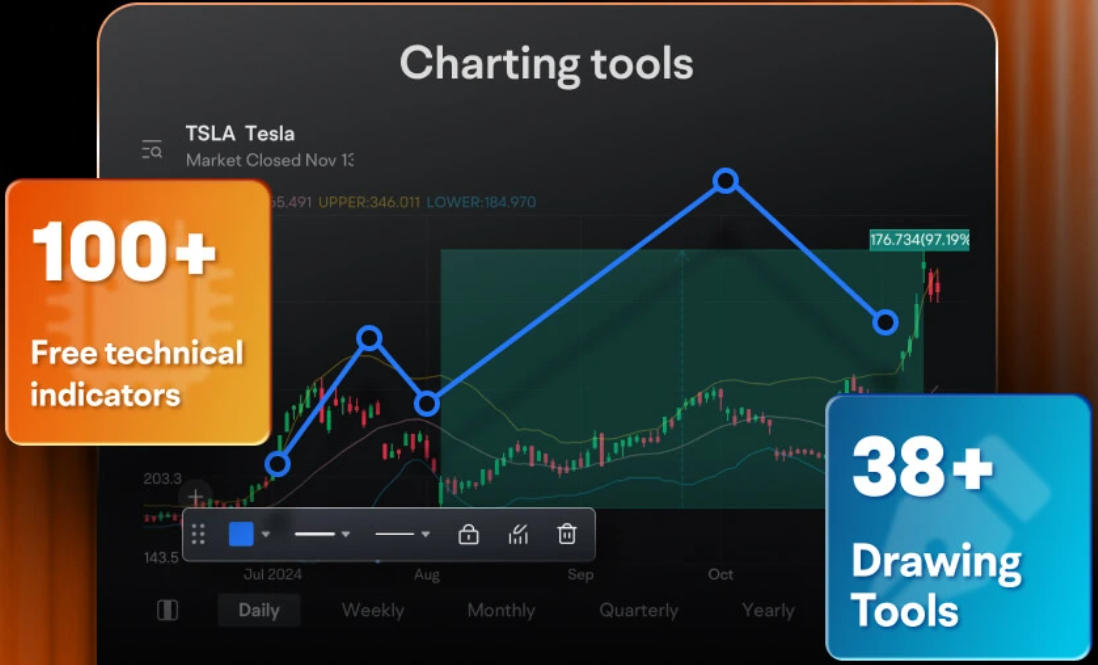
I saw 63 technical indicators listed in a dropdown menu, 38 drawing tools in a sidebar, and real-time data refreshing every 0.03 seconds. I stared at the screen for about four minutes, closed the app, and made myself a coffee.
This is the moomoo experience for most beginners. Not confusing exactly. More like being handed the cockpit controls of a commercial aircraft when you asked for directions to the airport. The tools are extraordinary. The problem is knowing which five of the sixty-three you actually need, what they’re telling you, and what to do about it.
This article is my attempt to solve that problem. Not by teaching you everything — that would take a semester. By teaching you the specific tools inside moomoo that give you the most useful signal with the least noise, and by showing you exactly where to find each one and how to use it step by step.
One disclaimer before we start: no tool predicts stock prices with certainty. Anyone who tells you otherwise is selling something. What technical analysis actually does is help you understand the probabilities — where a stock is likely to go based on its own historical behavior and the behavior of everyone buying and selling it. That’s not nothing. It’s quite a lot, in fact. But it’s not a crystal ball.
Why moomoo Is Actually Built for This
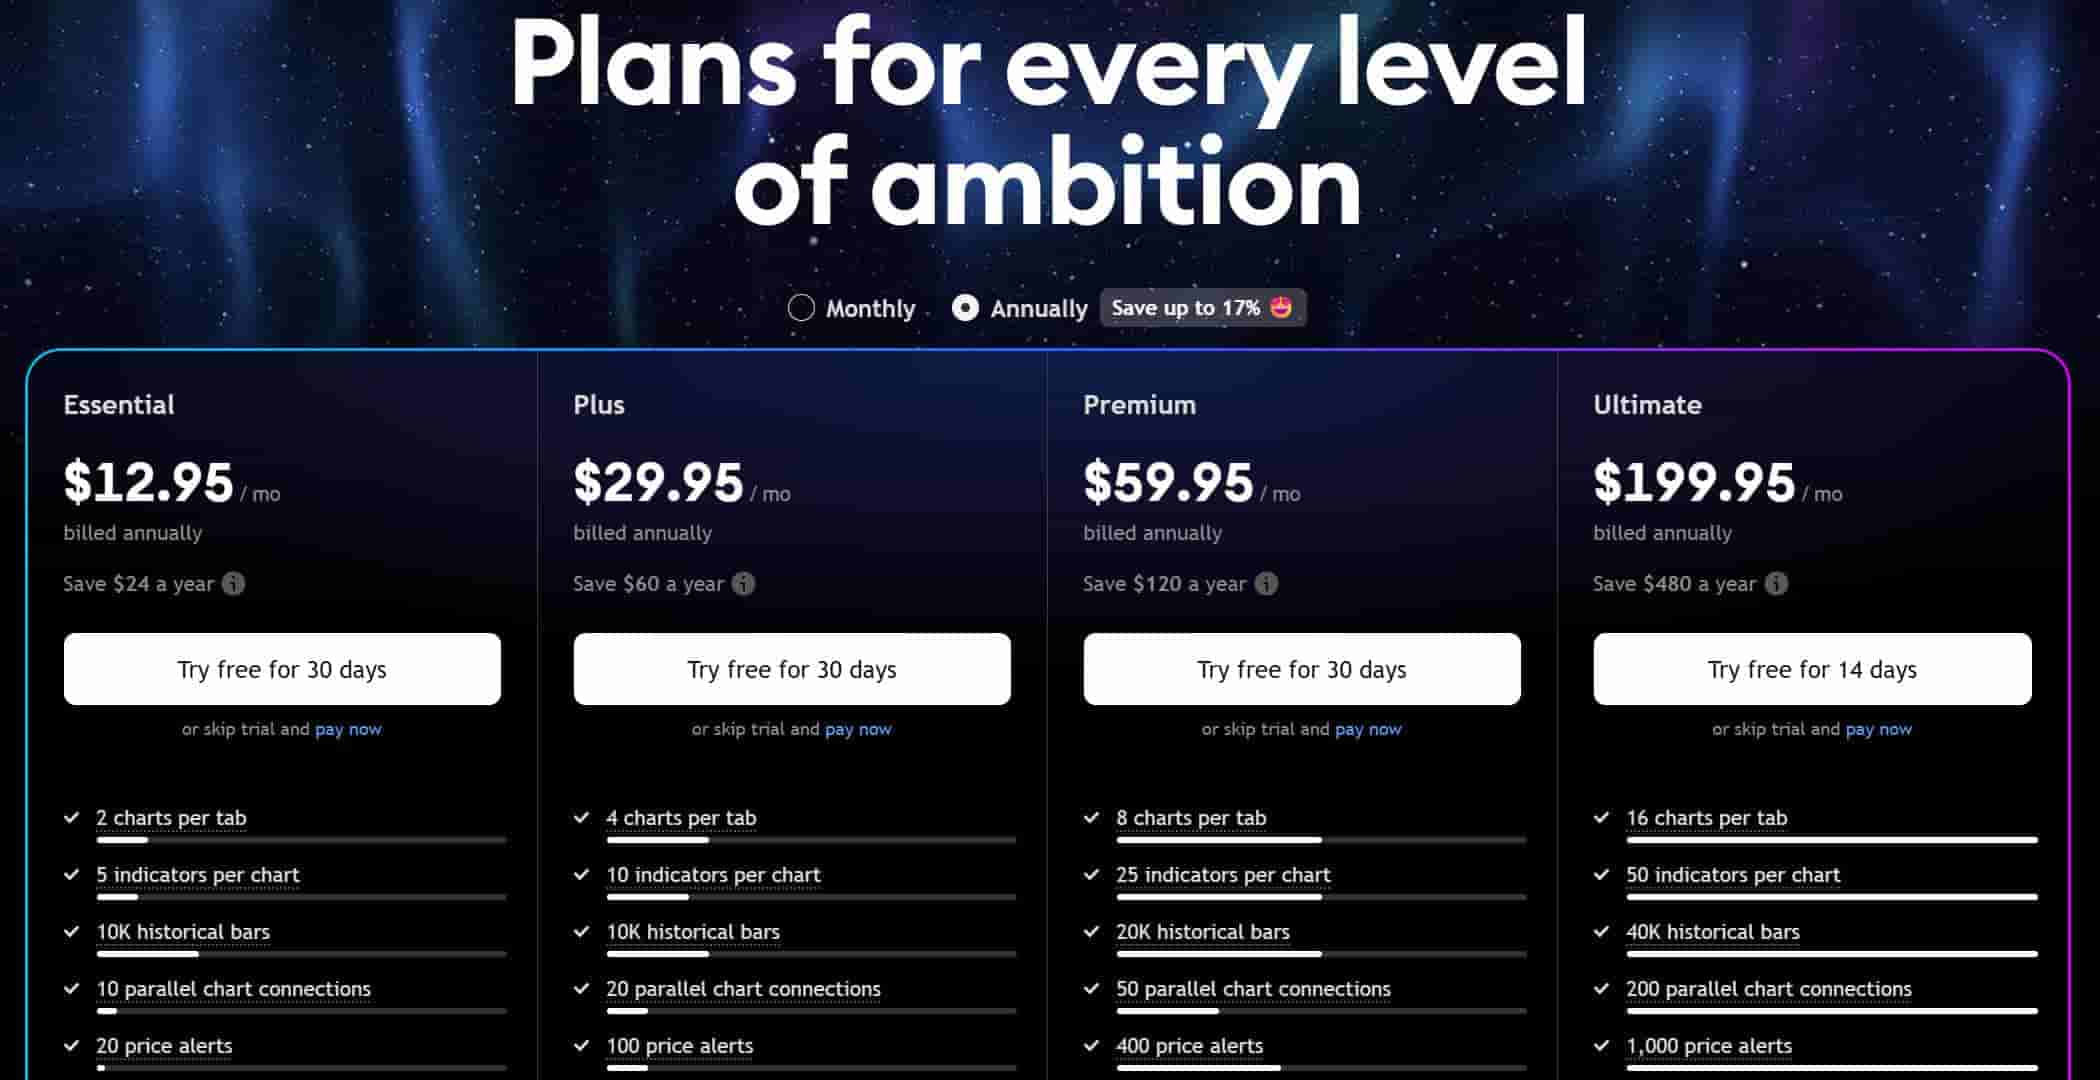
Most retail brokerages give you a line chart, some news, and a buy button. moomoo gives you something that used to cost institutional traders thousands of dollars per month.
The platform provides 63+ technical indicators, 38 drawing tools, 190+ pre-set functions for building custom indicators, real-time Level 2 market data showing the full order book depth, multi-chart layouts allowing simultaneous monitoring of multiple stocks across multiple timeframes, a paper trading account with up to $1 million in virtual funds to test strategies risk-free, a stock screener with both technical and fundamental filters, an earnings calendar with valuation context, analyst ratings from third-party research firms, and a social community where you can see what other traders are watching.
That is a professional-grade toolkit. Used intelligently, starting with the right five percent of it, it gives beginners a genuine edge over people who are making decisions based purely on news headlines and gut feelings.
Here is how to use it.
Module One: Setting Up Your Chart the Right Way
Before you can read a stock’s story, you need to set up your chart to tell it clearly.
Step 1: Open the stock you want to analyze. Tap the search bar at the top of the moomoo app. Enter the stock ticker — NVDA for Nvidia, AAPL for Apple, SPY for the S&P 500 ETF. Tap the result to open the stock page.
Step 2: Navigate to the chart view. On the stock page, swipe or tap to the “Chart” tab. You will see a default candlestick chart. If you see a line chart instead, tap the chart type icon in the top toolbar and switch to candlestick.
Why candlestick, not line? A line chart shows you only the closing price each period. A candlestick shows you four data points: the opening price, the closing price, the high, and the low. That four-dimensional picture is where price behavior lives. A stock that opens at $100, surges to $115, and closes back at $102 looks flat on a line chart. On a candlestick chart, it looks like what it is: a failed rally with sellers winning by the close. The story is completely different.
Step 3: Set your timeframe. At the top of the chart, you will see timeframe options: 1D, 5D, 1M, 3M, 6M, 1Y, 5Y. For beginners doing basic analysis, the most useful combination is:
| Timeframe | What It Shows | When to Use It |
|---|---|---|
| 1D (intraday) | Price movement within today | Day trading, entry timing |
| 1W | Last 5 trading days | Short-term momentum |
| 1M | Last month, daily candles | Swing trading setup |
| 3M | Quarter view | Identifying trend direction |
| 1Y | Full year | Major support/resistance levels |
| 5Y | Long-term picture | Overall trend, cycle position |
For most beginners making weekly or monthly investment decisions, start with 3M to understand the trend, then zoom into 1M for your entry timing.
Step 4: Switch to a candle interval. Within the chart, you can adjust the time each candle represents. Tap the candle interval setting — usually a number near the top of the chart. Options include 1-minute, 5-minute, 15-minute, 1-hour, 1-day, 1-week. For beginning investors who are not day trading, daily candles on a 3-month or 1-year chart is the correct starting point.
Module Two: The Three Indicators That Actually Matter for Beginners
Here’s my honest opinion on moomoo’s 63 indicators: most of them are redundant for beginners. They are all doing some variation of the same three things — measuring trend direction, measuring momentum, and measuring whether a stock is overbought or oversold.
You need one indicator from each category. Everything else is noise until you understand those three.
Indicator One: Moving Averages — For Trend Direction
A moving average smooths out the daily noise of price movement and shows you the underlying direction. The 50-day simple moving average calculates the average closing price of the last 50 trading days. The 200-day moving average does the same across 200 days.
The relationship between these two lines is one of the most watched signals in all of technical analysis.
How to add moving averages in moomoo: Tap the indicator icon — it looks like a small graph icon, usually in the top toolbar of the chart. Select “MA” or “SMA.” Add two: one set to 50 periods, one set to 200 periods. Set them to different colors so you can distinguish them easily.
What you’re looking for:
| Signal | What It Looks Like | What It Means |
|---|---|---|
| Golden Cross | 50-day MA crosses above 200-day MA | Historically bullish — long-term uptrend potentially starting |
| Death Cross | 50-day MA crosses below 200-day MA | Historically bearish — downtrend potentially starting |
| Price above both MAs | Price line is above both moving averages | Stock is in an uptrend |
| Price below both MAs | Price line is below both moving averages | Stock is in a downtrend |
| Price bounces off 50-day MA | Price dips to MA, then rises | MA acting as support — potential buy signal |
The Golden Cross on the S&P 500 has historically preceded positive 12-month returns roughly 73% of the time across data going back to 1950. It is not a guarantee. It is a probability shift worth paying attention to.
Indicator Two: RSI — For Overbought and Oversold
RSI stands for Relative Strength Index. It runs on a scale of 0 to 100 and measures how quickly a stock has been moving relative to its own recent history.
The conventional interpretation is simple: above 70 means the stock may be overbought and due for a pullback. Below 30 means it may be oversold and due for a bounce. Between 40 and 60 is neutral territory.
How to add RSI in moomoo: Tap the indicator icon. Search for “RSI.” Add it. It will appear as a separate panel below your price chart, running as a line between 0 and 100. Keep the default setting of 14 periods.
Practical RSI interpretation:
| RSI Reading | Signal | Beginner Action |
|---|---|---|
| Above 70 | Overbought | Consider waiting for pullback before buying |
| 50–70 | Bullish momentum | Uptrend likely continuing |
| 40–60 | Neutral | No strong directional signal |
| 30–40 | Bearish momentum | Downtrend may be continuing |
| Below 30 | Oversold | Potential bounce, but don’t catch falling knives |
One critical nuance: a stock can stay above 70 for weeks in a strong uptrend, and can stay below 30 for weeks in a strong downtrend. RSI is a support tool, not a trigger. When RSI is above 70 and you see a candlestick reversal pattern at the same time, that combination is more meaningful than either signal alone.
Indicator Three: Volume — The Confirmation Signal
Volume is the number of shares traded during a period. It is the most underrated tool on the platform. Here’s why it matters: price movement without volume is suspicious. Price movement with high volume is significant.
In moomoo, volume appears as bars at the bottom of the chart by default. Green bars indicate volume on days the price closed up. Red bars indicate volume on days the price closed down.
What volume tells you:
| Price Action | Volume | Interpretation |
|---|---|---|
| Price rises sharply | High volume | Strong buying conviction — move is likely real |
| Price rises sharply | Low volume | Weak move — likely to reverse or stall |
| Price falls sharply | High volume | Strong selling — downtrend may continue |
| Price falls sharply | Low volume | Sellers losing conviction — possible bottom forming |
| Price consolidates | Declining volume | Coiling before a move — watch for breakout |
| Price breaks key level | Volume spike | High-conviction breakout — more likely to hold |
Module Three: Level 2 Data — Seeing the Order Book
This is the feature that most retail brokers charge for and moomoo provides for free.
Level 2 data shows you the real-time bid and ask prices at every price level — not just the best bid and best ask, but the entire queue of buyers and sellers stacked up behind the current price. It is essentially a real-time X-ray of supply and demand.
How to access Level 2 in moomoo: On the stock page, tap the price quote area at the top. You will see “L2” or “Order Book” as a tab option. Tap it.
What you will see: The left side shows bids — buyers and the number of shares they want to buy at each price level below the current price. The right side shows asks — sellers and how many shares they’re willing to sell at each price level above the current price.
How to read it:
| Scenario | What It Looks Like | What It Suggests |
|---|---|---|
| Large bid wall | Thousands of shares stacked at a specific price below current | Strong support at that level — price may bounce |
| Large ask wall | Thousands of shares offered at a specific level above current | Resistance — price may struggle to break through |
| Bids larger than asks | More buying interest than selling interest | Short-term bullish pressure |
| Asks larger than bids | More selling pressure than buying interest | Short-term bearish pressure |
| Thin order book both sides | Low total volume at all levels | High volatility risk — small trades move price significantly |
A practical example: if you are watching a stock at $50 and you see a massive bid wall of 200,000 shares at $49.50, that tells you there is significant buying interest at that level. Professional traders refer to this as a price magnet — the stock may dip toward $49.50 and find strong support there. Whether to act on that is your judgment call, but you now know it exists.
One caveat: large orders in the book can be and frequently are cancelled before execution. This practice, called spoofing in its more manipulative forms, means you should treat Level 2 as supporting evidence, not as certainty.
Module Four: The Stock Screener — Finding Candidates Before Analyzing Them
Everything above assumes you already know which stock you’re looking at. The screener solves the upstream problem: how do you find the right stock to look at in the first place.
How to access the screener in moomoo: Tap “Markets” in the bottom navigation bar. Look for “Screener” or “Stock Screener.” On the desktop version, it appears in the left sidebar.
Setting up a basic screener for swing trading candidates:
| Filter | Setting | Reason |
|---|---|---|
| Market | US Stocks | For US market focus |
| Market Cap | Above $2 billion | Avoid illiquid small caps |
| Average Volume | Above 1 million shares/day | Ensures liquidity to enter/exit |
| RSI (14-day) | Between 40–55 | Not overbought, showing momentum building |
| Price above 50-day MA | Yes | Uptrend confirmed |
| Price above 200-day MA | Yes | Long-term trend positive |
| Earnings Growth YoY | Positive | Fundamental backing for technical move |
This screener will return stocks that are technically trending up, have room to run before becoming overbought, and have solid fundamentals underneath the price action. That is your hunting ground.
Save your screener settings in moomoo — tap the save icon — so you don’t have to rebuild it each time you use it.
Module Five: Earnings Calendar — The Event That Changes Everything
Earnings reports are the single most important scheduled events in any stock’s calendar. A stock can trade completely normally for three months, then move 15% in a single session after an earnings release. Understanding the earnings calendar is not optional.
How to access it in moomoo: Tap “Markets,” then look for “Calendar” or “Earnings Calendar.” You can also access it from an individual stock page — scroll down to the “Events” or “Financials” section.
What the earnings calendar shows you: The date and time of the upcoming earnings report — before market open (BMO) or after market close (AMC). The analyst consensus estimate for EPS and revenue. The company’s actual results from previous quarters. Whisper numbers in some cases — the informal market expectation that differs from the official consensus.
A strategy framework around earnings:
| Scenario | Typical Outcome | Beginner Approach |
|---|---|---|
| Stock up strongly before earnings | Often “sell the news” — stock dips after | Consider waiting until post-earnings to buy |
| Stock down before earnings | Sometimes “buy the rumor” reversal | Higher risk — wait for actual results |
| EPS beat + Revenue beat | Usually positive reaction | Watch size of move vs. expectations |
| EPS beat + Revenue miss | Mixed reaction | Read management guidance carefully |
| EPS miss | Usually sharp selloff | Unless guidance is raised — then watch for recovery |
| Strong guidance raise | Often outweighs a modest miss | Key signal for long-term investors |
For beginners, the safest earnings strategy is simple: know when your stocks report, don’t open new positions within three days before an earnings release, and wait until after the report to evaluate your next move based on actual results rather than speculation.
Module Six: Paper Trading — Practice Before You Pay
This is the feature most beginners skip and most experienced traders wish they had used more.
moomoo’s paper trading account gives you up to $1 million in virtual money to trade in real market conditions with real-time prices. You make the same decisions you would make with real money, but nothing in your actual bank account changes.
How to access paper trading in moomoo: Tap your profile icon. Look for “Paper Trading” or “Simulated Trading.” Set up a virtual account with the amount closest to what you plan to actually invest — say $10,000 if that’s your real starting capital. Using $1 million when you only have $5,000 to invest will give you unrealistic feedback.
What to practice specifically:
Use the paper account to test the indicator combinations above. Set up a trade based on a Golden Cross signal. Watch whether the RSI was confirming. Check the volume. Then track whether the trade worked or not over the following weeks. This feedback loop is the fastest way to develop an instinct for which signals in your specific market context are reliable.
Run at least 20 paper trades across different market conditions before committing real money to a new strategy. This is not a suggestion. It is the minimum sample size needed to tell the difference between a strategy that works and a strategy that got lucky.
Module Seven: Analyst Ratings and News — The Fundamental Context
Technical analysis tells you how a stock is moving. Fundamental context tells you why, and more importantly, whether the move makes sense.
Analyst ratings in moomoo: On any stock page, scroll to the “Analyst Ratings” section. You will see a consensus rating — Strong Buy, Buy, Hold, Sell, Strong Sell — along with the distribution of individual analyst opinions and the price target range.
How to interpret analyst targets practically:
| Analyst Consensus | Stock at | Target | Reading |
|---|---|---|---|
| Strong Buy, 8 analysts | $45 | Average target $65 | Significant upside expected — worth investigating |
| Buy, 12 analysts | $85 | Average target $88 | Limited upside priced in — risk/reward tight |
| Hold, 15 analysts | $30 | Average target $28 | Analysts mildly bearish — proceed carefully |
| Sell, 6 analysts | $20 | Average target $14 | Analysts expect further decline |
Analyst targets are not gospel. They are one data point. What makes them useful is combining them with your technical picture. A stock with a Strong Buy consensus and a technical breakout on high volume is a different proposition than a stock with the same consensus that just crossed below its 200-day moving average.
News integration: moomoo’s news feed can be filtered by the stock you’re viewing. Look for a customizable alert system — set price alerts and news alerts for your watchlist stocks. This means instead of checking the app obsessively, you get notified when something worth your attention happens.
Putting It All Together: A Complete Analysis Workflow
Here is the exact sequence I use when evaluating a new stock position. You can run this analysis inside moomoo entirely.
Step 1: Open the stock. Check the 1-year chart with daily candles. Identify the overall trend. Is the price above or below the 200-day moving average?
Step 2: Add the 50-day moving average. Has there been a Golden Cross or Death Cross recently? Where is the price relative to both averages?
Step 3: Check RSI on the daily chart. Is it below 60? If you are looking to buy, you want room to run. If RSI is already at 75, the near-term entry is risky regardless of how good the story sounds.
Step 4: Check volume. Has the recent price action been accompanied by expanding or contracting volume? A price rise on shrinking volume is a warning sign.
Step 5: Switch to a 3-month chart, then a 1-month chart. Identify key support and resistance levels — price points where the stock has repeatedly stopped or reversed. These become your targets and stop-loss levels.
Step 6: Check the earnings calendar. When is the next report? Plan your position size and timing around it.
Step 7: Read the analyst consensus. Is the fundamental story consistent with the technical picture, or are they contradicting each other?
Step 8: If everything aligns — trend up, RSI has room, volume confirms, earnings not imminent, analysts constructive — paper trade it first. Run the analysis, execute the paper trade, then review whether the outcome matched your thesis within four to six weeks.
Only after doing this process correctly on paper are you ready to do it with real money.
The Honest Limits of All of This
Technical analysis is a probabilistic tool, not a predictive one. The indicators above have historically improved decision quality for the people who use them correctly and consistently. They have not eliminated losing trades for anyone. They will not eliminate losing trades for you.
The most common beginner mistake with these tools is treating a signal as a certainty and sizing the position accordingly. A Golden Cross with RSI at 55 and volume confirmation does not mean the stock will go up. It means the conditions are historically associated with upward movement more often than not. There is a significant difference.
Position sizing — never risking more than 1-2% of your total portfolio on a single trade — is what keeps a losing streak from being a catastrophe. moomoo’s tools help you find better trades. Managing how much you bet on each of them is what determines whether you’re still in the game a year from now.
Use the paper account. Respect the indicators as guidance, not commands. Review your trades systematically to understand what worked and what didn’t. Do this long enough and seriously enough, and the 63 indicators that looked overwhelming on day one will eventually start looking like an old friend’s very large wardrobe — you’ll know exactly which five items you actually wear.
StockVane does not hold positions in any securities mentioned. This article is for educational purposes only and does not constitute financial advice. All platform features referenced are based on moomoo’s publicly available feature documentation as of May 2026. Past performance of technical indicators does not guarantee future results.