Interactive Brokers has a reputation problem. Not the kind that involves fraud or hidden fees. The opposite kind. Its reputation is that it’s too powerful, too complicated, and built for people who wear a headset at work and have three monitors. The beginner opens Trader Workstation for the first time, sees approximately one thousand clickable things, and quietly goes back to Robinhood.
I understand that impulse. I had it myself.
But here’s the thing that changed my mind. Most of the tools inside IBKR that look intimidating are solving problems you already have — you just haven’t named the problems yet. You want to know where a stock is trending. Whether it’s likely to bounce or keep falling. Whether the move you’re watching is real or just noise. IBKR has specific tools for each of those questions. The challenge isn’t that they’re hard to use. The challenge is knowing which ones to look at first. Just a reminder, IBKR has lite or pro products.
This guide solves that. We start with the platform that makes sense for beginners, build up to the tools that actually matter for predicting price direction, and walk through each one step by step. No finance degree required.
One honest disclaimer first: no tool predicts stock prices with certainty. Technical analysis shifts probabilities. It doesn’t guarantee outcomes. Anyone who says otherwise is selling a course.
Understanding the IBKR Platform Ecosystem First
IBKR doesn’t have one trading platform. It has four, which is part of why people get confused.
| Platform | Best For | Complexity | Where to Access |
|---|---|---|---|
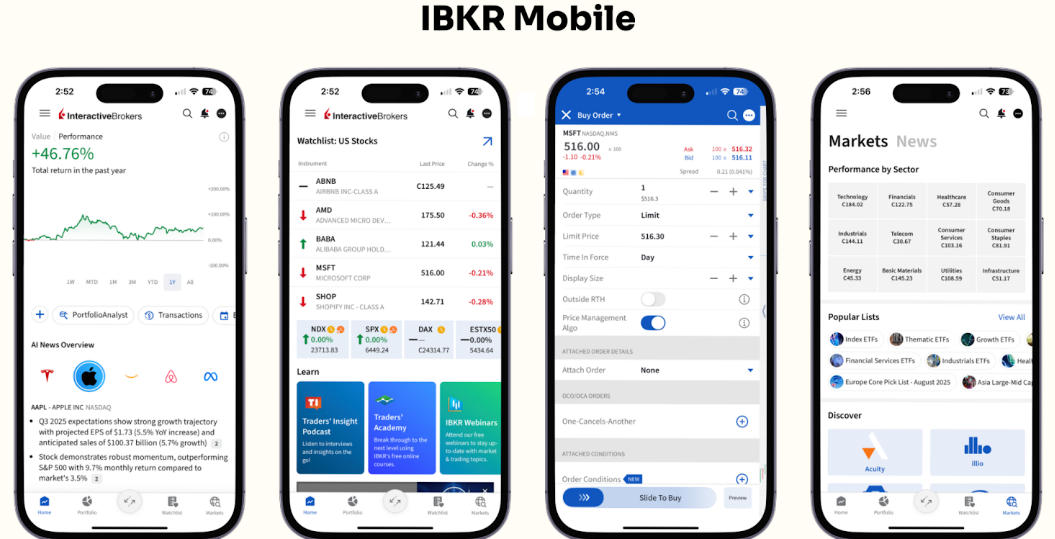
| IBKR Mobile / GlobalTrader | Quick trades, watchlists, basic charts on the go | Low | iOS / Android app |
| Client Portal | Account management, basic charting, research, news | Low-Medium | browser at ibkr.com |
| IBKR Desktop | Improved TWS-lite experience, cleaner interface | Medium | Downloadable desktop app |
| Trader Workstation (TWS) | Full professional toolkit, advanced charting, scanners, risk tools, algos | High | Downloadable desktop app |
For beginners learning to analyze stock price movements, the correct starting point is IBKR Desktop or Client Portal — not TWS. TWS is extraordinary but its interface will overwhelm you before you learn anything. IBKR Desktop gives you access to the meaningful analysis tools without burying you in options you won’t use for months.
Once you’ve built comfort with the core tools — which we’ll cover in detail below — TWS opens up additional capabilities that are genuinely worth the learning curve.
Setting Up IBKR Desktop for Stock Analysis
Before you can use any tool, you need the platform configured for analysis rather than just trading.
Step 1: Download and install IBKR Desktop. Go to interactivebrokers.com, navigate to “Trading” → “Platforms” → “IBKR Desktop.” Download the installer for your operating system. Installation takes about five minutes.
Step 2: Log in with your IBKR credentials. Use the same login as your Client Portal. Two-factor authentication will be required — have your phone ready.
Step 3: Set up a watchlist. In IBKR Desktop, look for the “Watchlist” panel. Click the plus icon to add a new watchlist. Name it something useful — “US Tech Watch” or “Current Positions.” Add tickers by typing them in the search field. Your watchlist is where you track the stocks you’re monitoring before you trade them.
Step 4: Open a chart for any stock. Right-click any ticker in your watchlist. Select “Chart.” A chart window will open with the stock’s price history in candlestick format. This is your primary workspace for everything that follows.
Module One: Charting and the Technical Indicators That Actually Matter
IBKR’s charting interface supports a wide array of technical indicators. Most of them you will never need. Here are the ones that give beginners the most signal relative to the noise they produce.
Moving Averages — The Trend Compass
A moving average smooths daily price volatility into a single line showing the underlying direction of a stock. The two most important ones are the 50-day simple moving average and the 200-day simple moving average.
How to add moving averages in IBKR Desktop: Open a chart. Click the “Indicators” or “Studies” button in the chart toolbar — it typically looks like a small graph icon. Search for “Simple Moving Average” or “SMA.” Add it twice: once with a period of 50, once with a period of 200. Assign different colors so you can distinguish them on the chart.
What the moving average relationships tell you:
| Signal | What It Looks Like | Historical Implication |
|---|---|---|
| Golden Cross | 50-day MA crosses above 200-day MA | Long-term uptrend beginning — historically bullish |
| Death Cross | 50-day MA crosses below 200-day MA | Long-term downtrend beginning — historically bearish |
| Price above both MAs | Price line sits above 50 and 200-day | Stock in confirmed uptrend |
| Price below both MAs | Price line sits below 50 and 200-day | Stock in confirmed downtrend |
| Price touches 50-day and bounces | Price dips to MA level, then recovers | MA acting as dynamic support |
| Price touches 50-day and breaks through | Price drops below MA with conviction | Support broken — bearish signal |
The Golden Cross on the S&P 500 index has historically been followed by positive 12-month returns approximately 73% of the time across data since 1950. That’s not a guarantee. But a 73% historical hit rate is a meaningful probability tilt.
RSI — The Overbought and Oversold Detector
RSI stands for Relative Strength Index. It runs from 0 to 100 and measures how quickly a stock has been moving relative to its own recent behavior. Above 70 means the stock may be overextended to the upside. Below 30 means it may be oversold to the downside.
How to add RSI in IBKR Desktop: In the chart’s indicator menu, search for “RSI.” Add it with the default 14-period setting. It will appear as a separate panel below your price chart, running as a line between 0 and 100.
RSI interpretation table:
| RSI Level | Signal | Beginner Interpretation |
|---|---|---|
| Above 75 | Strongly overbought | High risk entry — consider waiting for pullback |
| 60–75 | Bullish momentum | Uptrend likely continuing, but gains may slow |
| 40–60 | Neutral | No strong directional signal |
| 25–40 | Bearish momentum | Downtrend may be continuing |
| Below 25 | Strongly oversold | Potential bounce — but confirm before buying |
Critical nuance: a stock can stay overbought for weeks during a strong trend. RSI above 70 doesn’t mean “sell now.” It means “the risk/reward for a new long entry has deteriorated.” Used alone, RSI will send you wrong signals. Used alongside moving averages and volume, it becomes genuinely useful.
MACD — Momentum Before the Price Moves
MACD stands for Moving Average Convergence Divergence. It’s a momentum indicator that often signals trend changes slightly before they become obvious on the price chart — which is exactly what you want for predicting price movements rather than just confirming them after the fact.
MACD consists of two lines and a histogram. The MACD line represents the difference between a 12-period and 26-period exponential moving average. The Signal line is a 9-period average of the MACD line. When MACD crosses above the Signal line, momentum is shifting bullish. When it crosses below, momentum is shifting bearish.
How to add MACD in IBKR Desktop: In the indicator menu, search for “MACD.” Add it with default settings (12, 26, 9). It appears as a separate panel with two crossing lines and a bar histogram.
MACD signal table:
| Signal | What to Look For | What It Suggests |
|---|---|---|
| Bullish crossover | MACD crosses above Signal line | Momentum shifting upward — potential buy signal |
| Bearish crossover | MACD crosses below Signal line | Momentum shifting downward — potential sell signal |
| Zero line cross up | MACD crosses above zero | Trend turning positive — confirms bullish crossover |
| Zero line cross down | MACD crosses below zero | Trend turning negative — confirms bearish crossover |
| Bullish divergence | Price makes lower low, MACD makes higher low | Selling pressure weakening — potential reversal |
| Bearish divergence | Price makes higher high, MACD makes lower high | Buying pressure weakening — potential reversal |
MACD divergence is one of the more powerful signals in technical analysis. When a stock is making new price highs but MACD is declining, the move is losing momentum even if the price chart looks strong. This is the kind of signal that is hard to see by looking at price alone.
Module Two: IBKR’s Market Scanner — Finding the Right Stocks Before You Analyze Them
Most beginners skip the scanner entirely and wonder why their stock picks feel random. The scanner solves the problem of where to look.
IBKR’s Market Scanner — available in both TWS and IBKR Desktop — scans the entire market in real time using criteria you define. It is looking at thousands of stocks simultaneously and returning only the ones that match your specifications. Instead of you hunting for opportunities, the scanner does the hunting.
How to access the Market Scanner in IBKR Desktop: In the main menu, look for “Scan” or “Market Scanner.” In TWS, it appears under “New Window” → “Market Scanner.” A window opens with a dropdown to select scan criteria.
Beginner-friendly scanner configurations:
Scanner Setup 1 — Momentum Breakout Candidates:
| Filter | Setting | Purpose |
|---|---|---|
| Instrument | Stocks | US equity focus |
| Exchange | SMART/US exchanges | Broad US market |
| Market Cap | Above $2 billion | Avoid illiquid small caps |
| Average Volume | Above 500,000 shares/day | Ensure you can exit easily |
| RSI (14-day) | 45–60 | Room to run, momentum building |
| Price above 50-day MA | Yes | In uptrend |
| Price vs 52-week high | Within 20% | Near potential breakout level |
This scan returns stocks in uptrends that haven’t yet overextended — the sweet spot before a potential continuation move.
Scanner Setup 2 — Oversold Bounce Candidates:
| Filter | Setting | Purpose |
|---|---|---|
| Market Cap | Above $5 billion | Larger companies tend to recover |
| RSI (14-day) | Below 35 | Deeply oversold |
| Price decline from 52-week high | 20–40% | Significant pullback but not broken |
| Positive EPS last 4 quarters | Yes | Fundamentally sound |
| Average Volume spike | Current volume 1.5x average | Capitulation selling potentially occurring |
This scan finds quality companies that have been beaten up and may be approaching a reversal point.
Save your scanner configurations in IBKR for reuse. Once you build the scans once, running them takes seconds.
Module Three: Level II Market Data — Reading the Order Book
This is where IBKR separates itself from most retail platforms. Level II data — sometimes called Market Depth — shows you the entire queue of buy and sell orders at every price level, not just the best bid and ask.
Think of it this way. The standard price quote tells you the stock last traded at $50.25. Level II shows you that there are 12,000 shares waiting to buy at $50.10, 8,000 at $50.00, 45,000 at $49.75 — and 20,000 shares being offered for sale at $50.50, 15,000 at $50.75, and so on. You can see the wall of supply above and the cushion of demand below.
How to access Level II in IBKR: In TWS, right-click a stock and select “Market Depth Trader” or “Book Trader.” In IBKR Desktop, look for “Level II” or “Depth of Book” in the chart options. A separate panel opens showing stacked bid and ask prices with their respective volumes.
Note: Level II data for US stocks may require a market data subscription depending on your account type. Check your account’s market data subscriptions under Client Portal → “Market Data.”
How to interpret Level II:
| What You See | What It Means | Potential Implication |
|---|---|---|
| Large bid cluster at a specific price | Many buyers willing to purchase at that level | Strong support — price may bounce there |
| Large ask cluster above current price | Many sellers waiting at that level | Resistance — price may struggle to break through |
| Bids much larger than asks | More total buying interest than selling | Short-term upward pressure |
| Asks much larger than bids | More total selling interest than buying | Short-term downward pressure |
| Rapidly thinning bids below price | Buyers pulling orders — support weakening | Price may fall further than expected |
| Large order appears then disappears | Potential spoofing — artificial order book manipulation | Treat with caution, don’t trade on it alone |
One important caveat about Level II: large orders can be and frequently are cancelled before they execute. Market participants sometimes place large visible orders to create a false impression of support or resistance, then cancel them when price approaches. This is called spoofing in its more aggressive form. Use Level II as one data point among several, not as a standalone decision trigger.
Module Four: IB Risk Navigator — Portfolio-Level Thinking
This is the IBKR tool that most beginners have never heard of and most experienced traders use daily. Risk Navigator gives you a real-time, portfolio-wide view of your exposure — not just what each stock is doing, but how your entire portfolio behaves as a system.
For beginners, the most valuable function is the “what-if” analysis. You can model a hypothetical position — “what if I buy 100 shares of NVDA at $240?” — and see how it changes your total portfolio’s exposure, sector concentration, and estimated behavior in different market scenarios before you make the trade.
How to access Risk Navigator: In TWS, go to “New Window” → “Risk” → “Risk Navigator.” A dashboard opens showing your current portfolio positions and their aggregate characteristics.
Key Risk Navigator metrics for beginners:
| Metric | What It Shows | How to Use It |
|---|---|---|
| Net Delta | How much your portfolio moves for each $1 move in the underlying | Higher delta = more directional exposure |
| Beta-Weighted Delta | Portfolio sensitivity relative to S&P 500 | Tells you if you’re effectively long or short the broad market |
| Sector Concentration | What % of your portfolio is in each sector | Avoid over-concentration in one sector |
| Stress Test P&L | Estimated gain/loss in various market scenarios | “What happens to my portfolio if the market falls 10%?” |
| What-If Analysis | Add hypothetical trades and see the impact | Evaluate a new position before entering it |
The stress test feature is particularly useful before major market events — earnings seasons, Fed meetings, geopolitical events. You can run a scenario that models a 5% market decline and see exactly which of your positions will hurt most. This knowledge lets you either hedge proactively or at minimum not be surprised when it happens.
Module Five: IBKR’s News Feed and Fundamental Research Integration
Technical analysis tells you how a stock is moving. News and fundamental data tell you why — and whether the move makes sense.
IBKR integrates several research and news sources directly into the platform, available from within the stock’s information panel.
How to access research in IBKR: Click any stock in your watchlist. The information panel that opens shows tabs for Quote, Chart, News, Fundamentals, and Analysts. Navigate between them using the tab bar.
What each research tab provides:
| Tab | What’s Inside | How Useful for Beginners |
|---|---|---|
| News | Real-time headlines from multiple sources | High — shows catalysts for price moves |
| Fundamentals | Revenue, EPS, margins, growth rates, balance sheet | High — confirms whether story matches technicals |
| Analysts | Consensus rating, price targets, individual analyst views | Medium — directional indicator, not gospel |
| Options | Options chain, implied volatility, put/call ratios | Advanced — save for later |
| Short Interest | Percentage of float sold short | Medium — very high short interest can signal squeeze potential |
Reading analyst targets practically:
| Analyst Consensus | Stock Price | Average Target | Interpretation |
|---|---|---|---|
| Strong Buy, 10 analysts | $45 | $68 | Significant upside expected — investigate |
| Buy, 8 analysts | $90 | $93 | Minimal upside priced in — tight risk/reward |
| Hold, 12 analysts | $35 | $33 | Mildly bearish consensus — caution warranted |
| Sell, 5 analysts | $22 | $15 | Analysts expect further decline |
The most powerful use of analyst data isn’t following their target prices — it’s tracking when they revise them. A cluster of upward revisions from multiple analysts over a short period is a meaningful signal that the institutional view on a company is improving. IBKR’s fundamentals tab shows you revision history for EPS estimates, which is the specific data series that tends to lead stock price movement.
Module Six: Paper Trading Account — The Feature That Separates Serious Beginners from Impulsive Ones
IBKR’s paper trading account is funded with $1,000,000 in simulated equity. You use real market data, real-time prices, and the same order types available in your live account. Nothing in your real bank account changes based on what happens in paper trading.
This is the feature most beginners skip because it feels slow and boring. This is exactly why most beginners lose money in their first six months of real trading.
How to set up paper trading in IBKR: Log into Client Portal at interactivebrokers.com. Navigate to “Settings” or “Account Settings.” Look for “Paper Trading” and select “Create Paper Trading Account.” Your paper account is linked to your live account and uses the same login credentials. Switch between live and paper trading using the account selector at the top of the platform.
What to specifically practice in paper trading:
Use the paper account to test the indicator combinations above. Set up a trade based on a MACD bullish crossover with RSI below 60 and a bounce off the 50-day moving average. Execute the paper trade. Track whether the hypothesis played out over the following two to four weeks. Record your reasoning in a simple journal — a notes app works fine.
Run at least 20 paper trades before committing real money to any new strategy. Twenty is the minimum sample size to distinguish between a strategy that works and a strategy that got lucky.
Paper trading realistic expectations:
| Sample Size | What It Tells You |
|---|---|
| 1–5 trades | Almost nothing — pure luck |
| 6–10 trades | Starting to see patterns, but insufficient |
| 11–20 trades | Meaningful feedback on whether strategy has edge |
| 20+ trades | Statistically relevant signal for that market condition |
Module Seven: IBKR’s Economic Calendar and Earnings Tracker
Stock prices don’t move in a vacuum. They move in response to events. Knowing what events are scheduled is as important as knowing how to read a chart.
How to access the economic calendar in IBKR: In Client Portal, look for “Research” → “Economic Calendar” in the navigation. In TWS, check “News” → “Economic Calendar.” The calendar shows upcoming events — Fed interest rate decisions, GDP releases, inflation reports, earnings dates — along with the previous reading, expected reading, and market consensus.
Why this matters for price prediction:
A stock can have perfect technicals — uptrend, bullish MACD, RSI at 55, support holding — and then gap down 8% the morning after a Fed rate decision that nobody expected. The economic calendar doesn’t tell you what will happen at each event. It tells you when the high-risk windows are, so you can size positions accordingly or wait for the dust to settle before entering.
Earnings dates specifically:
| Period | Risk Level | Beginner Approach |
|---|---|---|
| More than 2 weeks before earnings | Normal | Standard position sizing appropriate |
| 1–2 weeks before earnings | Elevated | Reduce position size or wait |
| 3 days before earnings | High | Avoid opening new positions |
| Earnings day | Very high | No new entries — watch, don’t trade |
| 1–2 days after earnings | Normalizing | Evaluate entry based on reaction to results |
Putting Everything Together: A Complete IBKR Analysis Workflow
Here is the exact sequence to run when evaluating a new position candidate. Every step is executable inside IBKR.
Step 1: Run the momentum scanner to find candidates. Start with the breakout setup — RSI 45–60, price above 50-day MA, within 20% of 52-week high, volume above 500,000 per day.
Step 2: Open the 1-year daily chart for each candidate. Check the overall trend. Is the price above or below the 200-day moving average? Has there been a recent Golden Cross or Death Cross?
Step 3: Add RSI. Is there room to run? You want RSI below 65 for a new long entry to have decent risk/reward. If RSI is at 78, the near-term setup is risky regardless of how compelling the story.
Step 4: Add MACD. Has there been a recent bullish crossover? Is MACD above or below zero? Bullish divergence between MACD and price is a high-quality signal worth acting on.
Step 5: Check volume. Is recent upward price action accompanied by expanding volume? A price move on 60% of average daily volume is less convincing than a move on 150% of average volume.
Step 6: Open Level II. Where are the nearest major bid and ask concentrations? This defines your near-term support and resistance levels more precisely than the chart alone.
Step 7: Check fundamentals. Is EPS growing? Are analyst estimates being revised upward? A technically strong chart with deteriorating fundamentals is a more dangerous setup than it looks.
Step 8: Check the economic calendar. Is a Fed meeting, inflation report, or the stock’s own earnings release scheduled in the next 10 days? If yes, either reduce intended position size or wait until after the event.
Step 9: Open Risk Navigator. Model the hypothetical position. What does it do to your total portfolio’s beta-weighted delta? Are you adding to a sector already concentrated in your portfolio?
Step 10: Paper trade it. Execute the position in your paper account first. Set your entry, your target, and your stop loss before you place the trade. Review after four weeks.
The Honest Limits of All These Tools
I want to close with something that most technical analysis guides skip because it’s bad for engagement: these tools do not predict the future. They improve your odds. Improving your odds is meaningful over a large number of trades. It is not sufficient to make any individual trade a sure thing.
The investors who get the most from IBKR’s analytical toolkit are the ones who use it to make disciplined decisions consistently — not to find the one perfect trade that changes everything. Position sizing is part of this. If you use every tool in this guide correctly and still risk 40% of your portfolio on one position, you’re one bad earnings report away from a year’s worth of setbacks.
IBKR’s tools help you find better setups. Your own discipline determines whether those better setups translate into better outcomes over time.
Use the paper account seriously. Keep a trade journal. Review your losers as carefully as your winners. The platform is extraordinary. What you build on top of it depends on what you bring to it.
StockVane does not hold positions in any securities mentioned. This article is for educational purposes only and does not constitute financial advice. All IBKR features referenced are based on publicly available documentation as of May 2026. Feature availability may vary by account type, jurisdiction, and market data subscription. Past performance of any trading strategy or indicator does not guarantee future results.