
Sandisk’s stock is worth 17.5 times what it was a year ago. Boston Scientific’s is worth 44 cents on the dollar. Those two ends of the same list, a 1,653% gain and a 56% loss, are separated by companies you would not confuse for one another, and both are among the 293 U.S.-listed stocks worth at least $50 billion that StockVane covers.
I measured the price change of every one of the 293 from the September 19, 2025 close to the September 18, 2026 snapshot. The median stock rose 23%. 206 of the 293 are higher than a year ago and 87 are lower. That sounds like a healthy market, and for most holders it was. The tails tell you where the year was won and lost: 25 stocks more than doubled and 12 fell by more than 30%. My reading is that this was a year of clusters, not a year of the market. The winners were mostly hardware and semiconductor companies, the losers mostly software and internet, and a portfolio’s result depended on how much of each it held.
The distribution behind the median
An average hides the shape, so here is how the 293 split by one-year price change.
The middle is thick. 210 of the 293, or about 72%, landed between a 30% loss and a 50% gain. The tails are not symmetrical: 25 stocks doubled, while only 4 fell by more than half. Losses in large caps are bounded by the fact that a company worth $50 billion or more rarely goes to zero in twelve months, whereas the upside can run to multiples. That is arithmetic, not a forecast. A stock that falls 56% needs a gain of about 127% to get back, and one that rises 1,653% has gone up 17.5 times.
Look at what the middle contains. 135 stocks rose between 0% and 50%, the largest single bucket at 135. Another 75 fell but by less than 30%. Most large-cap holders lived in those two groups, and their year was neither a triumph nor a disaster. If you owned a broad basket, the headline numbers at the ends mattered less to you than the 206 that rose and the 87 that fell.
The equal-weighted mean gain was 42%, well above the 23% median, because a few very large gains pull it up. Weighting by market value gives 46%, since the biggest companies are also among the biggest winners. Three answers to the question “how did large caps do” range from 23% to 46%, which is a reminder to ask which one a source is quoting.
The ten best
| Stock | One-year change | Market value |
|---|---|---|
| SanDisk (SNDK) | +1,653% | $262B |
| Micron Technology (MU) | +525% | $1,147B |
| Moderna (MRNA) | +510% | $61B |
| Lumentum (LITE) | +452% | $84B |
| Dell Technologies (DELL) | +336% | $361B |
| Western Digital (WDC) | +315% | $159B |
| Seagate Technology (STX) | +291% | $195B |
| Intel (INTC) | +267% | $571B |
| ASE Technology (ASX) | +267% | $93B |
| Advanced Micro Devices (AMD) | +256% | $914B |
Nine of the ten are chip, memory, storage or computing-hardware companies. Sandisk, Micron, Western Digital and Seagate are four of the top seven. Lumentum, Dell, Intel and ASE Technology round out the hardware side, and AMD is tenth. Our piece on ASML and the timing problem in semiconductors covers the equipment side of that same cycle. Moderna, up 510%, is the one name near the top that is not technology, and a percentage gain from a low base is not evidence that the business is sound.
Size matters here too. Micron is worth $1.1 trillion and still rose 525%. Gains of that size at that scale are rare, and I would not read them as a template for what a $1 trillion company can repeat.
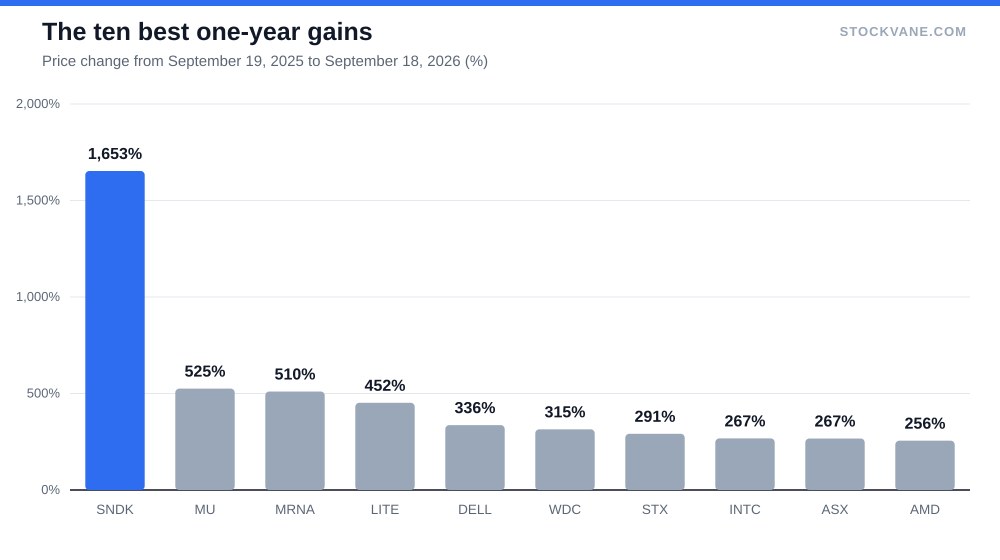
I am not attributing these moves to any single cause; our database has price and fundamentals, not the reasons buyers showed up. One reading is that the group moved together because investors priced them as a bloc. Our earlier note that the AI bottleneck moved from chips to power shows how quickly the market’s view of where value sits can shift inside one theme, which is a warning against extrapolating a group’s run.
The ten worst
| Stock | One-year change | Market value |
|---|---|---|
| Boston Scientific (BSX) | -56% | $63B |
| Intuit (INTU) | -55% | $81B |
| Applovin (APP) | -53% | $103B |
| Oracle (ORCL) | -52% | $446B |
| Sea (SE) | -47% | $62B |
| Netflix (NFLX) | -41% | $299B |
| PDD Holdings (PDD) | -39% | $112B |
| HDFC Bank (HDB) | -34% | $119B |
| KKR & Co (KKR) | -33% | $89B |
| Adobe (ADBE) | -32% | $99B |
The losers look different. Software and internet names dominate: Adobe, Intuit, AppLovin, Oracle, Netflix, PDD and Sea. Boston Scientific, KKR and HDFC Bank are the exceptions. Oracle’s 52% loss stands out because it is a $446 billion company; our piece on Oracle’s backlog and the stock’s demand for proof is the place to see the company-specific argument.
The edge of the losers list is soft. Adobe, tenth from the bottom, is down 32%, and the next name up the list is not far behind, so the exact order of the bottom ten depends on which day you pick. The cluster is the finding, not the ranking.
Count the sectors honestly. Of the twenty names across both tables, nine of the winners are hardware or semiconductor companies and seven of the losers are software or internet companies. Put those two groups side by side and a portfolio tilted toward software and away from hardware would have lagged by an enormous margin over this one year. I am not claiming the gap will persist, or that software is cheap now, only that concentration in one style was the main driver of results in this sample.
The odd one out: a medical device maker
Boston Scientific does not fit the software pattern, which is why I looked at it. The shares closed at $43.34, 59% below the 52-week high of $105.65 and only 3% above the low of $42.20. That is a large fall for a company whose revenue grew about 20% in fiscal 2025 to roughly $20.1 billion, with an operating-profit margin (StockVane’s EBIT margin) of 18.6%.
The valuation moved with the price. The stock trades at 17.5 times trailing earnings, against a five-year average of 69 in our data. Those are different measurements, and I read a five-year average this high as inflated by years when earnings were small. The point still holds: the multiple has compressed sharply, and analysts (21 of them, 90% rating it Buy) put the average target at $60, above the price.
There is a caution in the revenue line. Quarterly growth has slowed, from 20% and 16% in two 2025 quarters to 12% and 8% in the two most recent. And on September 9 a headline in our news feed said the company warned that a cybersecurity incident would have a “material impact” and might lead it to miss guidance. That headline is a fact about that day. It is not an explanation of the year’s fall, and price data alone cannot tell me how much of the decline preceded it. A fall of this size with growth still positive can be a repricing of the multiple, an earnings problem, or both, and the September 9 warning is the first hard sign of the second.
What a list like this can and cannot tell you
Before drawing conclusions, it helps to know what would change my mind about the cluster story. If the software and internet losers were simply unlucky, we would expect their fundamentals to have held up while prices fell. For Boston Scientific that is partly true, since revenue kept growing. For others I have not checked revenue in this piece, so I make no claim about them, and a reader who wants to act on any single name should open its financials first. The list is a map of where prices moved, not a diagnosis.
A one-year return list measures the past twelve months, from a start date I chose. Move the base by a day and the exact ranks change, and moving it by a month could reorder the ends of the list entirely. The clusters are stable across nearby dates. The exact percentages are not.
Second, the universe is survivors of a size cut. The screen keeps companies worth $50 billion or more today, so anything that fell so far that it dropped below that line is missing, which makes the losers list look milder than the full experience of holders.
Third, none of this says the winners are expensive or the losers cheap. Valuation is its own question; our piece on Costco at 50 times earnings shows how a steady business can carry a stock multiple that has little to do with its past year of returns. Our list ranks price change, and price change alone does not tell you about value. A stock down 56% can still be overpriced, and a stock up 500% can still be cheap if earnings grew faster.
The Boston Scientific report I would read first
Of the twenty names here, the one I would follow into its next report is Boston Scientific, because it is the loser with growing revenue. The company is scheduled to report on October 28. Revenue growth was 8% last quarter. If it prints in the single digits again, the market’s slower-growth story gets a second data point, and a multiple of 17.5 stops looking low. If growth holds near 8% or higher and management says the cybersecurity issue did not change full-year guidance, the year’s decline will look more like a repricing than a deterioration.
Financial disclaimer: The content on StockVane is for educational and informational purposes only and should not be construed as professional financial advice. Stock market investing involves risk of loss.
Sources: Price-to-earnings ratio (SEC Investor.gov glossary) (https://www.investor.gov/introduction-investing/investing-basics/glossary/price-earnings-pe-ratio) · Earnings reports (SEC Investor.gov glossary) (https://www.investor.gov/introduction-investing/investing-basics/glossary/earnings-report)