
On June 30, ASML closed at $1,986.87, the highest close in the database. Twenty-nine days later, on July 29, it closed at $1,550.69. That is a 22% fall in a month for a company whose most recent quarterly revenue, $9.3 billion, was up 21% from a year earlier.
The gap between those two facts is the whole subject here. ASML is the only supplier of the extreme-ultraviolet machines that print the finest circuits on a chip, so the business is as close to a monopoly as public markets offer. The stock, though, has spent the last year moving like something far more fragile. I think both descriptions are accurate, and that the second one is the reason to be careful with the first.
My view: the business earns its premium, the 53.2 trailing multiple leaves little room for a wobble in orders, and the honest way to own it is to size the position for a 20% drawdown that arrives with no change in the franchise.
Why the moat is as wide as it looks
Printing the smallest features on a chip needs light with a wavelength of a few nanometers, and only ASML builds the systems that produce and control it. A single leading-edge machine costs on the order of two hundred million dollars, ships in pieces that fill several aircraft, and takes months to install. Getting the technology to work took the company and its suppliers decades. No rival is close.
The financial statements show what that position pays. Gross margin was 52.8% in FY2025, up from 51.3% the year before, and operating margin was 35% on $32.7 billion of revenue. Net income came to $9.6 billion, a 29% net margin. Few hardware companies of this size keep 29 cents of every revenue dollar as profit.
Revenue has compounded unevenly. It went from $21.2 billion in FY2022 to $32.7 billion in FY2025, a rise of 54% over three years, and the path bent: FY2023 grew 30%, FY2024 grew 3%, and FY2025 grew 16%. Net income fell 3% in FY2024, the year revenue barely moved. That is what a capital-equipment business looks like when customers pause. You should expect it to happen again.
A second engine, the service and upgrade work on machines already installed, does not show up as a separate line in the data I have, so I will not put a number on it. It exists, and it is less cyclical than new system sales. But I cannot measure it here, and it should not carry the argument.
What the tape says about timing
Take the last 259 trading sessions in our price data, which sit on the ASML quote page. On 24 of them the stock moved 5% or more in either direction, and on 9 it fell by 5% or more. The worst single day was June 23 at -7.8%, followed by July 1 at -7.4% and September 14 at -7.3%. The best was June 11 at +9.5%.
Nine sharp drops in a year is a lot for a market leader.
Most of the 22% fall from the June 30 peak to the July 29 low came as a run of down days. The stock then recovered to $1,679.92, which is 15.9% below the 52-week high of $1,997 and 81% above the low of $929. Anyone who bought at the June 30 close is still about 15% under water today.
Look at the earnings dates to see how little the reports explain. The last one, on 2026-07-15, produced a move of +2.2%, close to the 2.4% average reaction. The 22% slide that finished two weeks later does not line up with a report. I will not assign a cause to it, since our news feed gives none. The pattern still matters: the largest swings come between reports, when the market re-prices the outlook for orders and for export rules.
Here is the practical consequence. If ASML can lose a fifth of its value in a month with no earnings shock and no change to the moat, then the timing skill required to buy at the right moment is unusually high, and most of us do not have it. Buying in stages is unfashionable advice, and it fits the tape.
Lumpy revenue, smooth narrative
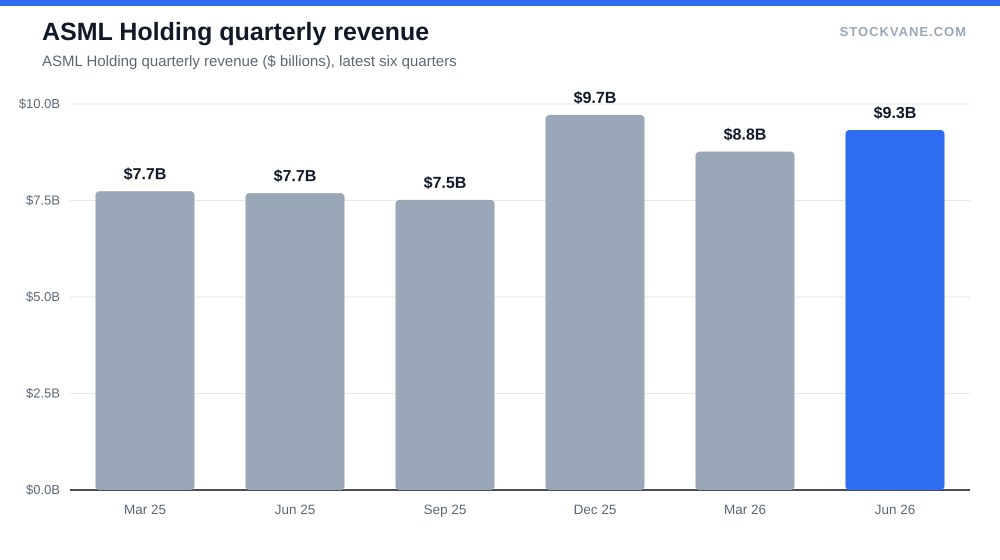
The last four reported quarters ran $7.52 billion, $9.72 billion, $8.77 billion and, most recently, $9.3 billion. The step from $9.72 billion to $8.77 billion was a 10% sequential decline in a year when full-year revenue rose. Then the latest quarter rebounded 6% from the prior one.
| Metric | Value | Context |
|---|---|---|
| Price (approx.) | $1,679.92 | 52-week range $929 to $1,997 |
| P/E (TTM) | 53.2x | Five-year average 40.0x |
| Price-to-sales | 16.0x | Five-year average 11.6x |
| Analyst ratings | 100% buy, 0% hold | 6 analysts; average target $2,392 |
| Dividend yield | 0.51% |
Bookings, the number the market watches most closely, are not in our database, so I cannot chart them. What I can show is that reported revenue already swings by ten percent from one quarter to the next. Orders, which lead revenue, swing more, and that is where the headline risk comes from. Customers are a short list of chipmakers, and each of them orders in large batches around when it builds or upgrades a fab. One delayed order can move a quarter.
Geography adds a second source of noise. In FY2025, China accounted for $9.5 billion, or 29.1% of revenue, ahead of Taiwan at 25.5% and South Korea at 25.0%. Everything else was smaller. A share near 29% in one country whose access to the newest machines depends on export rules is a fact I would not dismiss. If that share has to fall, the missing revenue has to come from the leading-edge customers, and the timing of their orders is exactly the thing that lurches.
What the multiple is asking for
At $1,680, the market value is $645.3 billion. The trailing P/E of 53.2 (see the valuation tab) sits at the 92nd percentile of its own five-year range, against a five-year average of 40.0. That is 1.33 times its own history. Price to sales tells the same story: 16.0 now against an average of 11.6, and the 94th percentile.
Analysts’ forward numbers are what make the multiple look tolerable. Forward EPS of $55.78 against trailing EPS of $31.60 implies 76% growth, and on that number the forward P/E is 30.1. Six analysts cover the stock on the analyst tab, all six rate it a buy, and the average target is $2,392, 42% above the price. The lowest target, $2,100, is still 25% above the price.
I would treat that unanimity carefully. A 100% buy rating from six analysts describes the sample and says nothing on the outcome, and a forward multiple of 30 is only comfortable if the 76% EPS jump arrives. When the market is paying 53 times trailing earnings, being 10% short on that forecast changes the multiple by a good deal more than 10% changes the story.
The same valuation math, applied to a stock with a different kind of demand, is worked out in our piece on Palantir’s valuation, and the comparison is useful: the question is always what growth rate the price already assumes.
What would make me wrong
There are two conditions I would watch. The first is a second consecutive quarter in which revenue falls sequentially while the multiple stays above 50. A decline like the one between $9.72 billion and $8.77 billion is survivable once, because the stock has already shown it can recover. Twice in a row would point at demand itself.
That is the line I would draw.
The second is the rate backdrop. The Fed raised its policy rate on September 16, and the dot plot hints at more. High-multiple stocks are sensitive to discount rates, and I laid out the mechanics in our note on the September hike. ASML’s price fell 7.3% on September 14, two days before that meeting, so that move came before the decision and cannot be a reaction to it, and a longer stretch of rising rates would keep pressure on a stock that trades at 1.3 times its history.
What I am not covering is the machine-level technical race, including High-NA adoption timing, because nothing in the data I use can measure it. If you want that view, it has to come from the company’s own technical disclosures.
Reading the valuation and quality pages together
The stock’s quantitative grade in our system moved from C in early September to B, a small step up. That fits a picture of a strong business with a stretched price rather than a screaming buy.
Short interest is 0.4% of the float, so nobody is positioned against the stock in size. That removes one source of squeeze risk and one source of contrarian support. The dividend is small, 0.51% on $8.60 per share, and it is not a reason to own the shares.
Compare this to a business where the price problem is different. In Oracle’s backlog story, the backlog figure is contractual and the question is whether the stock has already paid for it. ASML has the reverse problem: nobody doubts the franchise; the order flow that feeds it is the open question. Different risks call for different position sizes.
The revenue quarter I would want before adding
I would want to see a quarter of revenue at or above $9.3 billion, the latest print, with gross margin holding above 52%. That would show that the sequential dip in the middle of the last year was a pause and a turn would show up as a lower number, and it would give the 30.1 forward multiple some support from actual results.
Until then, I would hold what I own, add in thirds instead of all at once, and accept that a drop of 20% or more is the ordinary price of owning the best lithography business in the world. The stock has done it once in the past three months.
Gavin Thorne has invested in U.S. stocks for six years and previously worked at a large publicly traded internet company. He writes about income-oriented strategies, including cash-secured puts, and about how he reads company data. This article reflects his personal research process and is for informational purposes only. It does not constitute investment advice.
Sources: Dividends (SEC Investor.gov glossary) (https://www.investor.gov/introduction-investing/investing-basics/glossary/dividend) · Dividends tax topic (IRS) (https://www.irs.gov/taxtopics/tc404)