
Divide $426.9 billion by the $1.6 billion Palantir earned in fiscal 2025 and you get 261 times net income. Even on the last four quarters, which sum to $3.03 billion, the multiple is 141. Nobody buys that number as a bargain. The only honest question is what has to happen for the buyer to be paid anyway.
I ran that arithmetic, and my answer is in the title: the valuation works in one corner of the outcome map, where net income compounds at roughly 40% a year for five years and the market still pays about 40 times earnings at the end. Leave that corner in either direction and a holder at $178 falls short of the 10% a year I set as the bar.
What the business has already done
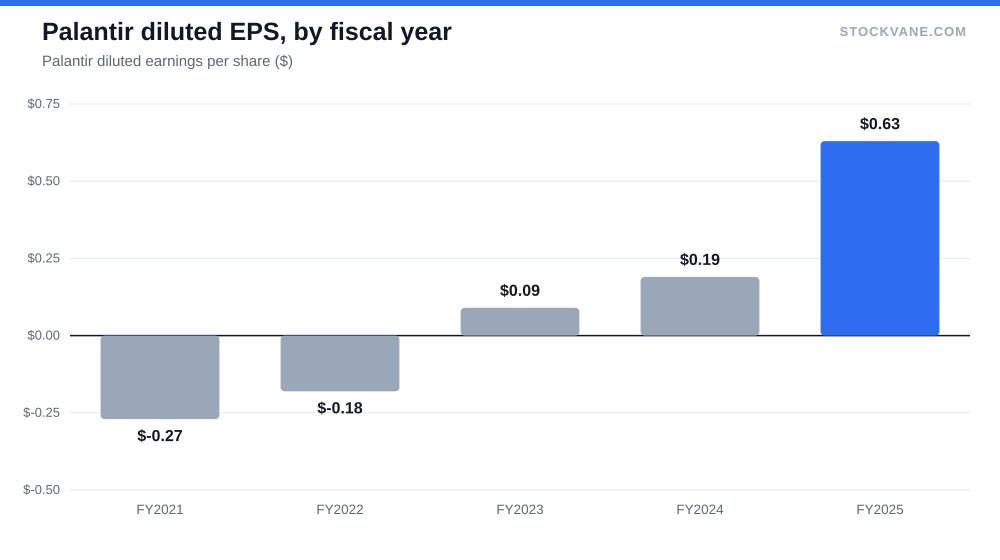
The financials page tells a strong story, and I will not pretend otherwise. Revenue went from $1.9 billion in fiscal 2022 to $4.5 billion in fiscal 2025, and the 56% growth of the latest year came on top of 29% the year before. Operating income swung from a $0.16 billion loss in fiscal 2022 to $1.4 billion in fiscal 2025. Net income was $0.5 billion in fiscal 2024 and $1.6 billion in fiscal 2025, a 37% net margin. Gross margin rose from 78.6% to 82.4% over the same stretch.
The latest quarter is louder. Second-quarter revenue was $1.9 billion, up 93% from a year earlier and 19% from the first quarter. Annualized, that is $7.7 billion of revenue, against $4.5 billion for the whole of last year. Net income for the quarter was $1.07 billion, against $0.33 billion a year earlier. The August 3 report moved the stock +29.5%, against an average earnings-day move of 12.8%.
The mix matters too. Government contributed 51% of second-quarter segment revenue and Commercial 49%. A company that people still file under defense contractor is now half commercial software, which is the reason growth can run this hot. It is also a reason to be careful with old assumptions about how predictable the revenue is.
None of that is in dispute. What I dispute is whether the price leaves any room for it to be merely very good.
What 65.3 times sales has meant before
Palantir trades at 65.3 times sales. Its own five-year average is 43.4, and the five-year range runs from 7.3 to 79.4, so today sits at the 72nd percentile of a history that already includes the 2021 software bubble. The industry average in the database is 7.2. On earnings, the trailing P/E of 151.8 sits next to a five-year average of 160.5, though that average is distorted by years of near-zero or negative profit, so I would not lean on it.
The forward numbers are gentler. Forward P/S is 39.8 and forward P/E is 87.4. The gap between the current and forward sales multiples is a ratio of 1.64, which I read as analysts expecting roughly 64% more revenue in the forward period than in the trailing one. On earnings, forward EPS of $2.03 against trailing $1.17 implies about 74% growth. Those are the expectations already sitting inside the price. They are not a bull case waiting to be discovered.
Set that beside the piece on Costco and its software-style multiple. Palantir at 87.4 times forward earnings is cheaper than that on paper only because its growth is many times larger. The shape of the bet is the same: a multiple is a claim about how long growth lasts.
The five-year arithmetic
Here is the exercise. Start with $426.9 billion today. To earn 10% a year for five years, a holder needs the company to be worth about $687 billion at the end, assuming no dilution and no dividends. Then ask what net income that requires at three exit multiples, and what growth rate it takes to get there from the $3.03 billion of the last four quarters.
| Exit P/E in year five | Net income needed ($B) | Annual growth from last four quarters |
|---|---|---|
| 25 times | $27.5 | 55% |
| 40 times | $17.2 | 41% |
| 60 times | $11.5 | 30% |
At a 60 times exit multiple, the company needs about $11.5 billion of net income and a 30% annual growth rate. That is a hard target, but the multiple is doing much of the work. At 40 times, net income has to reach $17.2 billion, which means compounding at 41%. At 25 times, a multiple that would still be generous for software of any kind, the requirement is $27.5 billion, a 55% growth rate.
Translate the middle case into revenue. If net margin were 40% (the latest fiscal year was 37%), reaching $17.2 billion of profit needs about $43 billion of revenue. The current run rate is $7.7 billion. That is a revenue compound rate of about 41% for five years.
The corner, then, is this: growth in the neighborhood of 40% for five years, margins that hold or expand, and a market that keeps paying 40 times earnings for a company that is by then far larger. Each piece is plausible. All three together is a narrow target.
The case that it can get there
The strongest argument for the corner is the growth already delivered. Net income grew 159% in fiscal 2023, 115% in fiscal 2024 and 249% in fiscal 2025. Fiscal 2026 is on a similar path if the second quarter is any guide. A business that has compounded profit at that pace for three consecutive years has earned the right to a premium, and I do not think the multiple contraction is automatic. Multiples can stay high while growth persists, and nothing in the record so far says the growth is fading.
The 22 analysts in the database have an average target of $201, 13% above the price, and 73% rate the stock a buy. The highest target is $255 (44% above the price). The lowest is $80, which is 55% below where the stock trades. That spread tells you something: even professionals who model this company for a living put it anywhere from half to one and a half times the current price.
Where the arithmetic breaks
Growth that decelerates is the first way out of the corner. Sequential growth last quarter was 19%. If the third quarter matched it, revenue would be about $2.3 billion. Growth of that speed is not something a company can sustain for five years, so the useful question is how fast it fades. A 60% grower that slows to 30% within three years does not clear the required rate, and the stock will be priced for that before it happens.
The second break is the multiple. The stock is 14.4% below its 52-week high of $208 after a 67% rise from the low of $106, so the market has already rerated it once this year. A stock that has gone up by two thirds off its low and now trades at the 72nd percentile of its own sales-multiple history is priced for continuation. If profit growth merely stays strong but the exit multiple falls to 25 times, the holder needs 55% growth to earn the same 10%, which is a very different bar.
The third is the quant grade. The database rates Palantir a D today, down from a C on September 8. I would not trade on a quantitative score alone, but it is consistent with what the multiples say: momentum is intact, valuation is not.
Short interest is only 2.7% of float, so there is no squeeze thesis here. The stock does not need one. It needs quarters like the last one, again and again.
What I would not conclude
I am not saying Palantir is a bad company or that the stock must fall. A good business at a full price can still deliver a decent return if the exit multiple holds. I am saying the outcome range is narrower than the bullish coverage suggests, and that most of the range is below a 10% annual return.
Other AI-linked names face the same test in different clothes: our Nvidia forecast asks it of a chip supplier, and the piece on Oracle’s backlog asks whether contracts already booked justify a price that assumes they convert. Palantir’s version is harder because the profit base it is compounding from is much smaller.
I am also not covering the contract-by-contract detail of government work, which the database does not break out and which I cannot verify. The arithmetic above uses only figures I can trace: fiscal-year and quarterly results, the current valuation gauges and the analyst range. If those inputs change, the corner moves.
For a reader who owns the stock already, this argues for position sizing rather than selling. A holding you can watch fall 40% without changing your mind is one you can keep. A holding that would force a decision at 40% is too large for the arithmetic above.
The quarterly revenue line that keeps the corner open
The next report is the test. Second-quarter revenue of $1.9 billion grew 19% sequentially. If third-quarter revenue comes in near $2.3 billion or better, the corner stays open. If sequential growth drops into the single digits while the stock is still near $178, the required rate in the table above stops being a stretch and becomes a fantasy.
Financial disclaimer: The content on StockVane is for educational and informational purposes only and should not be construed as professional financial advice. Stock market investing involves risk of loss.
Sources: Dividends (SEC Investor.gov glossary) (https://www.investor.gov/introduction-investing/investing-basics/glossary/dividend) · Dividends tax topic (IRS) (https://www.irs.gov/taxtopics/tc404)