
Elevance took in $698 million more revenue in the June quarter than a year earlier and kept $290 million less of it as profit. Sales were $50.47 billion against $49.78 billion. Net profit was $1.45 billion against $1.74 billion. Diluted EPS came in at $6.71, down 13.1% from $7.72.
That is the whole story of the stock in one line, and the headline on this post is the wider version of it. Revenue growth has slowed to 2.6% in the March quarter and 1.4% in June. Over the same two quarters EPS fell 16.8% and 13.1%. Six quarters ago the picture was reversed, with sales up 14.8% and 14.0% in the first two quarters of 2025.
My read is that $410.95 prices Elevance as a business whose margin has reset, not one whose growth has ended, and the evidence for that comes from three places: how the revenue base stopped rising, how much profit each dollar of premium now leaves behind, and what the multiple says about the market’s willingness to wait. The counter-case is that a reset margin can keep resetting.
Why growth fell off a cliff
The financials page shows quarterly revenue between $49.7 billion and $50.7 billion for four quarters in a row, at $50.71 billion, $49.75 billion, $50.18 billion, $50.47 billion. Nothing collapsed. The base simply stopped climbing after a year in which it climbed hard, and a flat line measured against a rising one produces a shrinking growth rate.
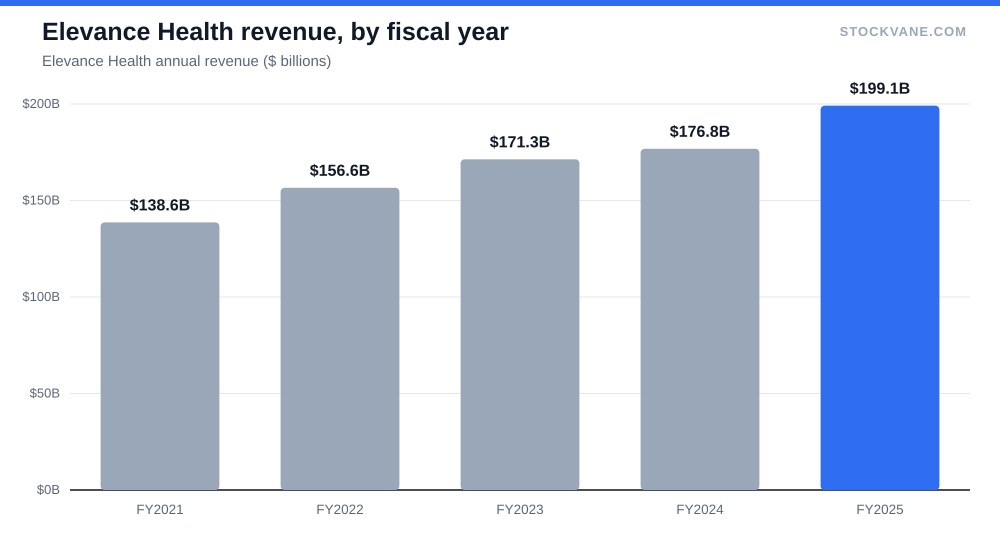
Compare the two ends. In the March 2025 quarter revenue was $48.89 billion, up 14.8%. By the June 2026 quarter, at $50.47 billion, the cumulative gain over five quarters was about 3.2%. The full-year figures tell the same thing from farther back: fiscal 2025 revenue was $199.1 billion, up 13% on $176.8 billion, and that year already contained the step up. Fiscal 2024 had grown only 3%, and 2023 9%. So the 13% year looks like the outlier and the recent 1% to 3% like a return to a mature insurer’s rhythm.
Why does that matter for the stock? Because a health insurer’s earnings are a spread. Premiums come in, medical claims go out, and what remains has to cover administration and leave something for shareholders. When revenue stops growing, there is no volume to hide a narrowing spread behind. Every point of medical-cost pressure lands directly on EPS.
We should be careful about what the database can and cannot say here. It records revenue, net profit and EPS for each quarter, but not the medical loss ratio, so I cannot tell you how many basis points of the profit decline came from claims and how many from administrative cost or investment income. What the numbers do show is the net result, and it is a narrower spread.
What a premium dollar leaves behind
In the June quarter Elevance kept 2.88 cents of net profit per dollar of revenue. A year earlier it kept 3.50 cents. The gap, 0.62 of a cent, sounds like rounding until it is multiplied by $50 billion, which is where the $290 million comes from.
| Metric | Value | Context |
|---|---|---|
| Price (approx.) | $410.95 | 52-week range $271 to $434 |
| P/E (TTM) | 18.2x | Five-year average 17.2x |
| Price-to-sales | 0.4x | Five-year average 0.6x |
| Analyst ratings | 65% buy, 35% hold | 17 analysts; average target $450 |
| Dividend yield | 1.67% |
The March quarter was worse. Net profit fell from $2.18 billion to $1.76 billion, a drop of 19.4%, on revenue that rose 2.6%. EPS fell 16.8%, from $9.61 to $8.00, a smaller percentage than net profit because the share count shrank through buybacks. Those buybacks cushion EPS by a few points and cannot rescue it.
Then there is the odd quarter. In the December 2025 period EPS was $2.47, up 36.5% from the year before, and September’s $5.32 was up 22.0%. A reader who only saw the second half of 2025 would have called this a recovery. Insurers report a lumpy year, with the fourth quarter typically the weakest, so the yoy comparison flattered when the base was depressed and punishes when it is not. I would not lean on either extreme. The trailing figure does the averaging for us: $22.61 of EPS over the last twelve months, against $25.21 for fiscal 2025, a decline of 10%.
Net income across fiscal years is a flat line in its own right. It was $6.0 billion in 2023, $6.0 billion in 2024 and $5.7 billion in 2025, on revenue that rose from $171.3 billion to $199.1 billion. That is $28 billion of additional revenue with no additional profit, and the margin arithmetic follows: about 3.5% of revenue in 2023, 3% in 2025.
The multiple pays for a recovery, but not a lavish one
The stock trades at 18.2 times trailing earnings and 16.6 times forward estimates. Its own five-year average is 17.2, which puts today’s multiple in the 58th percentile of its range, so no bargain in that frame. The Healthcare Plans group averages 21.5. Against peers the stock is cheaper by about three turns, against itself it is roughly at par.
Look at what the forward multiple implies. Analysts expect $24.71 of EPS, about 9% above the trailing figure. The market is not asking Elevance to return to the $25 territory of 2023 to 2025. It is asking for a bounce off the trough, which is a modest request. If the forward estimate is right, the multiple compresses from 18.2 to 16.6 with no move in the share price.
Price-to-sales tells a similar story from another angle: 0.4 now against a five-year average of 0.6, in the 23rd percentile of its band. Price to book is 2.0 against 2.6, also the 23rd percentile. Sales-based measures look cheap for an insurer precisely because the margin is thin. A low price-to-sales ratio on a 3% net margin says less than the same ratio on a 20% margin would.
The stock sits 5.4% below its 52-week high of $434 and 52% above the low of $271. That range is wide for a company with $50 billion in quarterly revenue. It tells you the market moved from pricing a disaster to pricing a repair, and it has been paying for the repair for some months. For anyone comparing the sector, UnitedHealth’s margin crisis makes the same point about how the group was re-rated on medical costs rather than on sales.
The valuation tab has the full ladder if you want to see the P/E band from 17.2 on average to the 19.6 top.
What the July report did to the price
The stock fell 8.5% on the July 15 report, the worst of the last four reactions. Before it came +0.0% +0.0% in April, +5.9% in January and -1.2% in October 2025. Across the four, the average absolute move was 3.9%, so July was more than double the norm.
An interesting detail is the April report. Net profit had fallen 19.4% and EPS 16.8%, yet the stock did not move. The market had priced that quarter in. July’s fall then came with a smaller EPS decline, 13.1%, which suggests the reaction was about something other than the headline: expectations for the second half, or guidance. The database does not carry the guidance text, and I will not guess at what it said. I will only note that a stock that ignores a 17% EPS decline and sells off 8.5% on a 13% decline was reacting to the outlook, not the quarter.
Analysts have not left. Of the 17 who cover it, 65% rate it a buy, 35% a hold and none a sell. The average target is $450, 10% above the price, with a range from $393 to $488. Even the low target sits only 4% below the market, which reads as a group that sees limited downside from here and is unsure how much upside. The quant grade slipped from B to C over recent weeks, a small mark of caution from the model side. Short interest is 2.5% of float, low for a stock that has just had an eight-point drop, so nobody is loudly betting on more of it.
The business underneath
Elevance is not one business. In the March quarter, Health Benefits, the insurance arm, was $42.49 billion of segment revenue. CarelonRx, the pharmacy benefit business, added $10.60 billion, and Carelon Services $7.37 billion. Net investment income was $765 million. The segment lines add to more than the reported total because sales between segments are eliminated in consolidation.
The mix matters for the margin debate. Insurance is where medical cost trends bite. The service and pharmacy lines are lower-risk and grow with volume but carry thin margins of their own. A stock that is 85% exposed to the insurance line, measured by segment share, will follow that line’s claims experience more than any diversification story would suggest. Whether the Carelon side (see the revenue segments for the split) can carry more of the profit is the long-term argument for the multiple, and it is one the quarterly numbers cannot settle.
What could make this wrong
The bullish reading needs the June quarter to be near the floor. It does not need a full recovery. Three things would break it.
First, another quarter with EPS below $6.71 would say the decline is not the 13% seen in June but something that still has room to run. The next report compares against a September 2025 quarter of $5.32, a lower bar than the last two, so a second year-over-year decline would be a harder failure to explain.
Second, revenue that turns negative would take away the one support the base has. Growth of 1.4% is thin. It would take only a small membership loss to make it flat or negative, and the effect on earnings would be unpleasant.
Third, the dividend cushion is real but not infinite. The stock pays 1.67%, or $6.86 over twelve months, which is about 30% of trailing EPS. That is comfortable. The payout matters less as a yield than as a signal: an insurer that keeps raising it while EPS falls is telling you what management thinks of the trough.
I am not covering the regulatory calendar, Medicare Advantage rate notices or Medicaid redetermination effects, all of which move the medical-cost line. The data here does not carry them, and I would rather leave them out than write vague sentences about them.
The quarter that decides whether June was the floor
The stock is priced as though $6.71 was the low. For that to be true, the report for the September quarter needs EPS above the $5.32 of a year ago, with revenue holding above $50 billion. Anything short of $5.32 and the 16.6 forward multiple starts to look expensive, not cheap.
Financial disclaimer: The content on StockVane is for educational and informational purposes only and should not be construed as professional financial advice. Stock market investing involves risk of loss.
Sources: Dividends (SEC Investor.gov glossary) (https://www.investor.gov/introduction-investing/investing-basics/glossary/dividend) · Dividends tax topic (IRS) (https://www.irs.gov/taxtopics/tc404)