
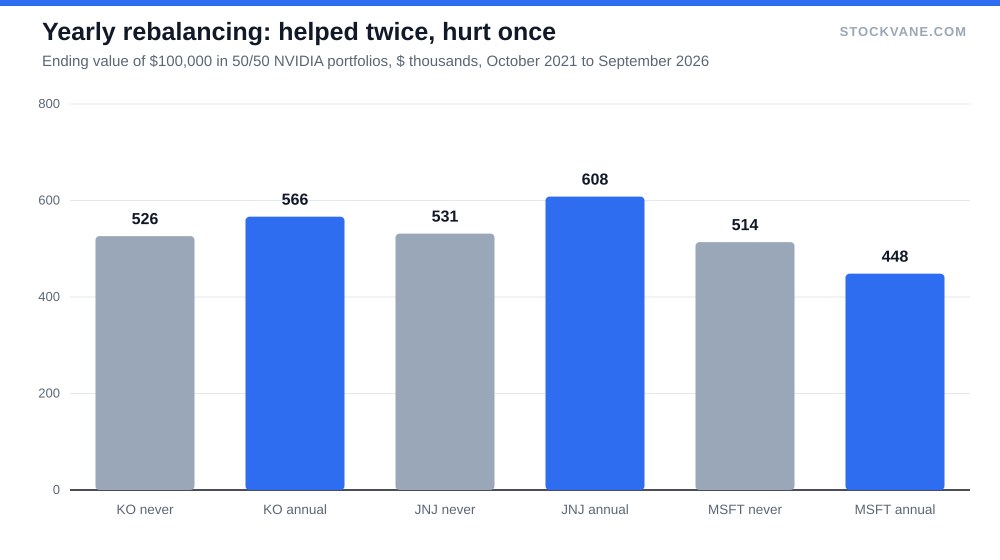
Take $100,000, put half in NVIDIA and half in a second stock in October 2021, and check back five years later. If the second stock was Johnson & Johnson, trimming the winner once a year left you $76,710 richer than doing nothing. If it was Microsoft, the same yearly trim left you $65,439 poorer. Same start, same discipline, same NVIDIA. The only thing that changed was the other half.
That swing is the honest answer to whether rebalancing works. It works when the assets you trim later stall, and it costs money when they keep going. Nobody knows in advance which case they are in. What rebalancing reliably does is hold risk near a level you chose, and whether that is worth its friction depends on how far your portfolio can drift before you stop sleeping.
We tested this on the StockVane price database, which carries monthly closes from October 2021 through September 2026. That is 60 monthly bars and about five years, a short window and an unusual one, because it contains a 2022 drawdown and then a long semiconductor run. Prices exclude dividends. No fees, no spreads. Read every dollar figure below as a comparison between rules, not a forecast.
What doing nothing looks like
NVIDIA closed October 2021 at $25.48 and September 2026 at $222.27, a gain of 8.7 times. Coca-Cola went from $48.99 to $88.25, or 1.8 times. Start them at $50,000 each and never touch either.
The first year looked like a case for buying more NVIDIA and selling nothing. The chip stock fell 52% to $12.11 by month twelve, while Coca-Cola barely moved. NVIDIA’s share of the two-stock portfolio dropped from 50% to 33%.
Then the drift ran the other way. By the end of year two NVIDIA was 60% of the portfolio, by year three 80%, by year four 85%, and at the September 2026 bar 83%. Nobody made a decision. The chip stock simply grew faster, and the account became a single bet with a small ballast attached.
That is the hidden cost of never rebalancing. The portfolio’s return was excellent, $526,183 from $100,000, but its risk was no longer the one the owner picked in 2021. A person who wanted a 50/50 split of growth and steadiness ended up 83/17 without placing a trade. Had NVIDIA repeated its first-year fall from the year-four peak, the account would have taken most of that hit.
The three rules we ran
We compared three ways to run the same two-stock portfolio. The first never rebalances. The second resets to 50/50 once a year, on the twelfth, twenty-fourth, thirty-sixth and forty-eighth monthly bars. The third resets whenever either side drifts more than ten points from 50%, a common band rule.
For the three pairings, every result below starts at $100,000.
| Second holding (with NVIDIA) | Never rebalance | Annual reset | 10-point band | Annual minus never |
|---|---|---|---|---|
| Coca-Cola (KO) | $526,183 | $566,436 | $457,899 | +$40,253 |
| Johnson & Johnson (JNJ) | $531,407 | $608,118 | $468,724 | +$76,710 |
| Microsoft (MSFT) | $513,681 | $448,242 | $413,453 | -$65,439 |
Two things stand out. The yearly rule beat doing nothing for the two defensive partners and lost to it for Microsoft. And the band rule lost to doing nothing in all three, by a wide margin.
The band result deserves a second look, because it is the rule many advisers recommend. It trades less often than a calendar rule in quiet stretches, yet it fires early when a winner starts running. With NVIDIA and Coca-Cola it triggered 5 times, selling NVIDIA into the first leg of a five-year climb. The rule did exactly what it said. The market simply paid more to the investor who did not.
Where the yearly rule paid
Pair NVIDIA with Coca-Cola and the annual reset produced $566,436 against $526,183 for buy-and-hold, a gain of $40,253. With Johnson & Johnson the figures were $608,118 and $531,407.
The mechanism is not mysterious. In year one NVIDIA fell and the rule bought more of it at $12.11, a price that later looked cheap by a factor of 18. Every later reset sold some of a rising stock and bought some of a slow one, and the slow one kept its value. When one leg is volatile and the other is calm, a periodic reset can harvest that volatility. It only needs the volatile leg to have somewhere to go and come back from.
Notice that the worst peak-to-trough drop of 32% was identical with and without rebalancing. It occurred in the first year, before the first reset happened. Rebalancing did not shield the account from the fall it was designed for, because it had not yet run. Its risk benefit came later, in the years when the portfolio was smaller than it would otherwise have been on the way down.
Where the yearly rule cost money
Now swap in Microsoft. The two-stock portfolio ended at $513,681 without rebalancing and $448,242 with it. Trimming NVIDIA to fund Microsoft meant selling the stock that rose 8.7 times to buy one that rose 1.6 times. Both stocks were winners. One was a bigger winner, and the rule leaned against it four times.
This is the case the textbook tends to skip. Rebalancing assumes the pieces of a portfolio move in different directions or at least at different speeds that eventually average out. Two large-cap growth stocks over a technology cycle do not necessarily do that. They can compound in the same direction while one compounds faster, and any rule that sells the faster one pays a toll every year.
The same logic shows up in a ten-stock version. We built an equal-weight basket of the ten largest names in the database with a full five-year record: NVIDIA, Apple, Alphabet, Microsoft, Amazon, TSMC, Broadcom, Meta, Tesla and Micron. Micron alone rose 15.1 times. Left alone, the basket ended at 4.60 times its start, with Micron at 33% of the account and the top three names at 68%. Reset once a year it ended at 4.53 times, and Micron still held 32%, because it kept outrunning the trims. Reset every month it ended at 4.02 times.
The gap between annual and never was about 8 cents per dollar. The gap between monthly and never was 58. The monthly rule traded 191% of the portfolio’s value over five years, against 53% for the annual rule. That is where the friction lives, and it grows faster than the benefit. We did not model costs, and a taxable investor would have paid them.
What it costs in a taxable account
Every reset that sells a winner realizes a gain. In the NVIDIA and Coca-Cola test the annual rule sold $178,922 of shares across four resets, on a portfolio that started at $100,000. If we assume a 15% tax on the gain in each sale, an assumption that will not fit everyone, the bill comes to about $18,997. That is against a pre-tax benefit of $40,253.
| Second holding (with NVIDIA) | Shares sold in four annual resets | Tax at an assumed 15% | Annual minus never, pre-tax |
|---|---|---|---|
| Coca-Cola (KO) | $178,922 | $18,997 | +$40,253 |
| Johnson & Johnson (JNJ) | $169,189 | $17,554 | +$76,710 |
| Microsoft (MSFT) | $118,025 | $12,705 | -$65,439 |
So most of the benefit survives in this example, but not all of it, and the tax is due in cash while the benefit sits in a portfolio that could still fall. The Microsoft column is the sobering one. The rule realized $12,705 of tax and delivered a smaller portfolio in exchange.
This is why the usual practical advice for a taxable account is to rebalance with new money first and with sales last. Direct new deposits, and dividends if you take them in cash, toward the lagging side. Inside a retirement account, where nothing is taxed on a trade, the argument for a calendar reset is stronger because the cost is only the spread. We have written about how to think about the flow of money between accounts and markets in our guide to fund flows, and about how the Fed’s path changes the appeal of bonds as a counterweight in this piece on the stuck Fed.
What I would take from the numbers
First, rebalancing is a risk tool, not a return tool. The one clear thing it did in every test was keep the winner from becoming most of the account. The NVIDIA and Coca-Cola pair, unrebalanced, reached 85% in one stock by year four. Whether you can tolerate that depends on what you would do in the year a 52% fall arrives at that weight.
Second, the frequency matters more than the fashion. Annual beat monthly in the basket by a wide margin, and a calendar reset beat a ten-point band in all three pairings. I would not read that as a law, because the window is short and NVIDIA’s path was extreme. But the direction fits the mechanism. The more often you trim a compounding stock, the more compounding you sell.
Third, the partner matters. A stock that tends to move against your winner, or at least slower, earns its place in a rebalanced portfolio. Two stocks that both grow at high rates can make the trim a tax on your own success. That is a question about what you own, and it links back to how you choose holdings in the first place, which we covered in how I pick stocks.
Two things this test does not cover. It ignores bonds and cash, so the classic 60/40 case is outside it, and it ignores transaction costs and dividends, which would narrow the gap between rules slightly in either direction. A study with bond funds needs a bond price history that the database does not hold, so we chose not to invent one.
A test to run at your next anniversary
Pick the one holding that is now the largest share of your account, and compare its weight today to what you first intended. If it has drifted more than about 15 points, say from 50% to 65%, that is the threshold where our two-stock portfolio was already carrying more risk than its owner had chosen. Trim the excess with new money if you can. If you must sell, do it once a year and not every time the gap opens.
If the gap is under 10 points, leave it alone. The tax and the missed compounding are real, and in the test above the rule that acted least often did best on a five-year view. The number I would watch is the winner’s weight at the next January statement: if it is above 70% and you cannot say why, the drift has made the decision for you.
Financial disclaimer: The content on StockVane is for educational and informational purposes only and should not be construed as professional financial advice. Stock market investing involves risk of loss.
Sources: Dividends (SEC Investor.gov glossary) (https://www.investor.gov/introduction-investing/investing-basics/glossary/dividend) · Dividends tax topic (IRS) (https://www.irs.gov/taxtopics/tc404)