
A $2.00 dividend check went out on September 11, and it was the second at that size. On a share that costs $943.54, one quarterly payment is about 21 cents per hundred dollars invested. That is not why anyone buys Parker Hannifin. The dividend matters because of its direction: the quarterly rate has gone from $1.48 to $1.63 to $1.80 to $2.00 in three consecutive years, raises of 10%, 10% and 11%.
Sales are moving the same way. Quarterly revenue reached $5.8 billion in the June quarter, 10% above a year earlier, and yet the stock sits 14.0% below its 52-week high of $1,098. My argument is that the dividend raise and the sales acceleration are both real, that the shares have already priced in most of it at 33.1 times trailing earnings, and that the number to watch is whether profit growth rises to meet revenue growth. So far it has not.
What the dividend record actually says
The dividend history in the database runs in a clean staircase. Through the first quarter of 2024 the payment was $1.48. From May 2024 to February 2025 it was $1.63, and the four payments from May 2025 to February 2026 were $1.80. The current $2.00 started with the May 2026 ex-dividend date, and the raise was announced on April 24. The same late-April timing showed up in 2024 and 2025. That is how a company behaves when the raise is a scheduled event rather than a reaction.
Annualized, $2.00 a quarter is $8.00 a share. Against trailing diluted earnings of $28.48, that is a payout of 28%, so the company keeps roughly seven dollars of every ten it earns. That cushion is the reason the raises have been able to run near 10% a year. A payout near 28% can absorb a bad year without a cut; a payout near 80% cannot.
The yield tells the other half of the story. The trailing yield on the quote page is 0.78%, built from $7.40 actually paid over the last twelve months, because the higher rate only covers two of the four payments in that window. At today’s rate the forward yield is 0.85%. Neither figure is an income yield. Anyone choosing between this and a 4% payer, the trade-off I laid out in High Dividend Yield vs Dividend Growth, is choosing growth of the payment over its size, and the growth here is about 10% a year with a payout ratio that leaves room.
Sales growth built over a year
Look at the last four reported quarters of fiscal 2026 (Parker’s year ends in June). Revenue was $5.08 billion, $5.17 billion, $5.49 billion and $5.75 billion, which is growth of roughly 4%, 9%, 11% and 10% against the same quarters a year earlier. The full-year figure was $21.5 billion, up 8% from $19.9 billion.
That follows a flat stretch. Fiscal 2024 revenue was $19.9 billion and fiscal 2025 was $19.9 billion: two years of essentially no growth after the jump to $19.1 billion in fiscal 2023. So the turn is recent, and a run rate of $23.0 billion on the latest quarter shows how much of the improvement sits in the second half of the year rather than the first.
| Fiscal 2026 quarter | Revenue | Growth vs year earlier |
|---|---|---|
| Q1 | $5.08 billion | 4% |
| Q2 | $5.17 billion | 9% |
| Q3 | $5.49 billion | 11% |
| Q4 (June) | $5.75 billion | 10% |
By segment, Diversified Industrial is 67.2% of fiscal 2026 revenue and Aerospace Systems is 32.8%. By geography, 64.3% comes from the United States. Parker makes motion and control parts: hydraulics, filtration, seals and the components that go into machines and aircraft. That is a business whose sales follow factory orders and aircraft build rates, which is why growth of 10% for three straight quarters counts as a broad recovery and not just a single good order.
Profit has not kept pace yet
Revenue rose 8% for the year.
Operating income rose from $4.05 billion to $4.63 billion, a gain of 14%, which is what you want to see: profit growing faster than sales. Gross margin improved from 36.9% to 37.7%, and the DB’s EBIT margin reached 23.1%.
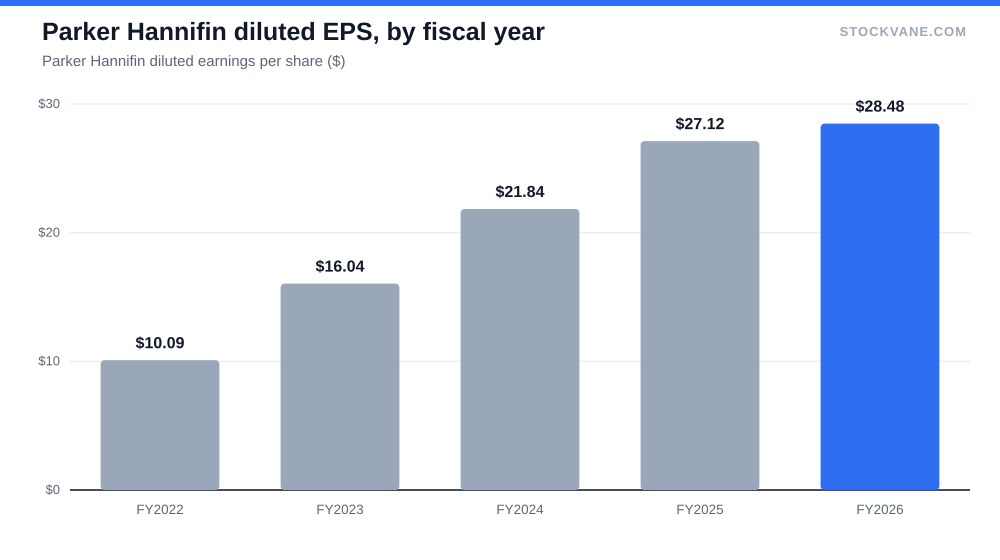
Then the bottom of the income statement disagrees. Net income was $3.6 billion, up 3% from $3.5 billion, and diluted EPS of $28.48 was up 5% from $27.12. Operating profit up 14% turned into per-share profit up 5%. The figures I have do not say why, and I will not guess; the reconciliation between the two lines (interest, tax, or one-time items) is in the filing and is the first thing I would open. Until it is explained, treat the 14% operating gain as the cleaner signal of the business and the 5% EPS gain as what shareholders actually received.
There is a pattern in the longer record too. Net income was $1.32 billion in fiscal 2022, $2.08 billion in 2023, $2.85 billion in 2024, $3.53 billion in 2025 and $3.65 billion in 2026. The compounding was fast through 2025 and slowed sharply in 2026. A stock that pays 33 times earnings needs the fast version.
Fourteen percent off the high is not a discount
| Metric | Value | Context |
|---|---|---|
| Price (approx.) | $943.54 | 52-week range $709 to $1,098 |
| P/E (TTM) | 33.1x | Five-year average 27.7x |
| Price-to-sales | 5.4x | Five-year average 3.6x |
| Analyst ratings | 77% buy, 23% hold | 13 analysts; average target $1,207 |
| Dividend yield | 0.78% |
The stock closed at $943.54 on September 18. It is 14.0% below the 52-week high of $1,098 and 33% above the low of $709. A stock that is 14% below its peak feels like it is on sale. Measured against its own history, it is not.
The trailing P/E is 33.1, against a five-year average of 27.7, and the valuation database puts today’s multiple in the 79th percentile of its own five-year range. Price to sales is 5.4 against a five-year average of 3.6; that gauge is at the 86th percentile. Book value shows the same thing at 7.5 against 5.8. Specialty industrial machinery peers average a P/E of 29.5, so Parker carries a premium of about 12% over its group on trailing earnings.
On forward numbers the picture is a little better. The forward P/E is 28.9, which comes from analyst estimates of $32.69 per share, 15% above the trailing figure. That is the assumption the price is built on. If profit growth is going to jump from 5% to 15%, the multiple is fair. If it stays near 5%, the stock is a 33-times multiple on single-digit growth, and the pull back toward the five-year average of 27.7 would mean a lower price at constant EPS, roughly $789. I compare this to how Costco at 50 times earnings forced a similar question: at some multiple, a good company still needs its growth to arrive on schedule.
What analysts and the tape are saying
Thirteen analysts cover the stock: 77% rate it a buy, 23% a hold and none a sell. The average target is $1,207, 28% above the price, with a range of $1,038 to $1,358. Even the lowest target is 10% above the current price, and the highest implies 44%. When the floor of a range sits above the price, the ratings reflect a consensus rather than a debate. I read that as mildly worrying for the stock’s next earnings reaction: a company with no sell ratings and 77% buys has little room to surprise upward on sentiment.
The last four earnings reports produced one-day moves of +7.3%, -4.0%, +3.5% and +7.8%, newest first, an average absolute move of 5.6%. Three of four were gains. The August 6 report, covering the June quarter, produced the +7.3%. The quant grade in the database has moved from D to C, better but still a middle grade. Short interest is 1.1% of float, so there is no squeeze setup either way.
For the flow side of this picture, I use the framework in how I analyze money flowing in and out of the market.
The case against my caution
The opposing case is straightforward and it has evidence behind it. Revenue growth of 10% has held for three quarters, gross margin has risen every year since fiscal 2021, from 27.2% to 37.7%, and the dividend has grown near 10% a year. Companies that manage all three tend to keep their multiples. A 33 times P/E on a business with a rising margin and a stepped dividend is a premium, not a bubble.
If EPS grows 15% over the next year as analysts assume, then the stock at $943.54 is trading at about 28.9 times next year’s profit, which is close to its group. In that world the 14% gap to the high is a chance to buy a compounding business at a small discount. I would be wrong about caution if the next two quarters convert most of the revenue gain into per-share profit.
What I am not covering
I am not modeling Aerospace Systems separately, because the database gives one revenue split and no segment margins, and I would only be guessing at the mix effect. I am also not attributing the price drop from the high to any single cause. There is a news feed for the ticker, but a headline feed does not establish why a stock fell, and I would not invent a reason.
The raise I would look for in April 2027
Three straight Aprils have brought a raise of about 10%. If the April 2027 announcement comes in near $2.20 a quarter, up 10%, the company is telling shareholders it expects profit to keep growing. A raise noticeably smaller, say under 5%, while the stock is still valued at 33 times earnings, would be the first sign the pace is slowing and would make the premium harder to defend.
Before that, the number I would hold Parker to is EPS growth, the one the valuation tab prices in. The trailing figure is $28.48; the analyst forward figure is $32.69. If the next reported quarters do not put per-share profit growth above 10%, the multiple has to come down to justify a price below today’s, and 14% off the high will turn out to have been the easy part.
Financial disclaimer: The content on StockVane is for educational and informational purposes only and should not be construed as professional financial advice. Stock market investing involves risk of loss.
Sources: Dividends (SEC Investor.gov glossary) (https://www.investor.gov/introduction-investing/investing-basics/glossary/dividend) · Dividends tax topic (IRS) (https://www.irs.gov/taxtopics/tc404)