
Multiply Union Pacific’s trailing earnings of $12.35 a share by its own five-year average multiple of 17.7 and you get $218. The stock closed at $279.37. The premium the market pays over that number is 28%, and it is the whole subject of this post.
On the valuation tab the P/E sits at 23.0 against that 17.7 average, a reading in the 86th percentile of the stock’s own five-year band, which runs from 10.1 to 25.3. The peer group looks different: the railroad industry average P/E is 25.4, so against its neighbors Union Pacific is not stretched. Against its own past, it is. I want to know what has changed enough to make the old yardstick the wrong one.
My answer, up front: the premium is defensible only if the June-quarter jump in revenue is the start of a new growth rate and not a one-off. Three years of flat sales cannot carry a 23 times multiple. One good quarter can begin to, and only just.
What the multiple is charging for
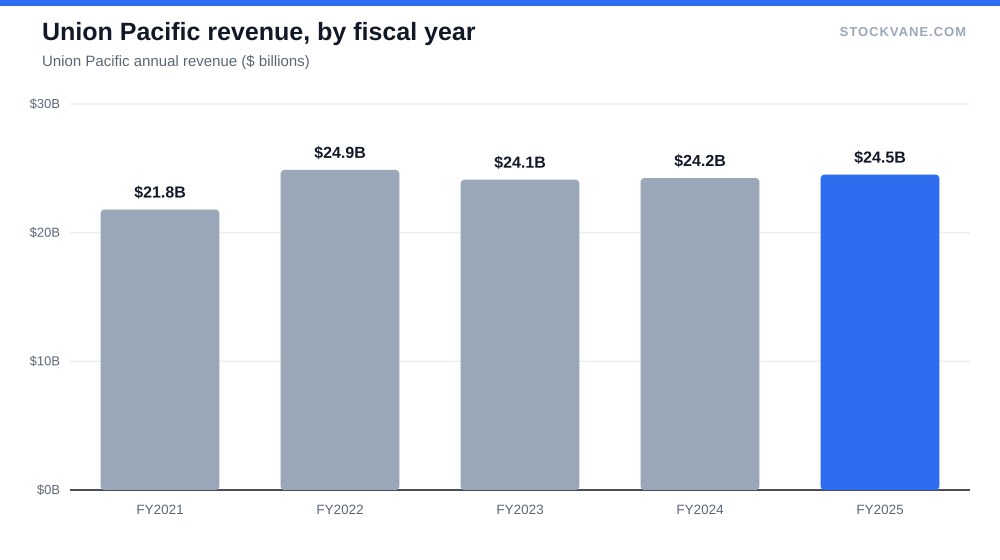
Start with what the last three years look like. Revenue was $24.9 billion in FY2022 and $24.5 billion in FY2025, a change of -1.5%. Net income went from $7.0 billion to $7.1 billion, up 2%. Diluted EPS rose from $11.21 to $11.98, or 7%. That gap between the 2% in profit and the 7% in per-share earnings implies the diluted share count fell by roughly 4.6% over the period. I read that as buybacks doing part of the work; the DB does not break out repurchases, so treat it as arithmetic and not as a reported figure.
So the earnings that the market pays 22.6 times were built partly by shrinking the denominator. That is a legitimate way to compound, but it has a ceiling. A company cannot retire 4.5% of its shares every three years forever without paying a higher and higher price for them, and at a 23 times multiple each repurchased share costs more earnings than it did at 17.
Margins are the more interesting side. Union Pacific’s EBIT margin, as the financials tab records it, was 42.7% in FY2025 after 39.7% in FY2023 and 41.5% in FY2024. The operating-income-over-revenue calculation gives a lower figure, 40%, because it uses a different definition of operating profit; I use the database EBIT margin throughout. Either way the direction is the same: three straight years of improvement from the FY2023 low, while revenue barely moved. Gross margin tells the same story, 45.5% in FY2024 and 45.8% in FY2025.
Railroads make money by running the same track with fewer costs per ton. When the volume is flat, the margin is the lever. It has been pulled a long way. FY2021’s 44.2% is the high in the recent record, so there is about 1.5 points still to recover, but no one should underwrite a stock on a lever that has an obvious stop.
The June quarter
Then came the quarter that changed the tone. Revenue for the June quarter was $6.9 billion, up 12% from a year earlier and 10% above the March quarter’s $6.22 billion. After a run of quarters that grew 3%, fell 1% and grew 3% again, this was a break in the pattern.
Annualize it and you get $27.5 billion, well above the $24.5 billion of FY2025. That is the number the bulls are capitalizing. If the quarter is the new base, forward earnings of $13.23 (implying 7% growth over the trailing figure) look cautious, and the forward P/E of 21.1 is less demanding than the trailing 22.6 suggests.
Here is the counter. The database records the revenue jump but not its source, and there is no news item in the record that explains it. A single quarter of 12% growth after three years of roughly nothing might be pricing, a mix of shipments, or timing. If it fades to the low single digits, the analyst target of $334 is chasing a run rate that does not exist.
There is a middle reading too. Suppose growth settles at 5% instead of 12%. Revenue would then reach about $25.7 billion on FY2025’s base, roughly 5% above the FY2025 figure, and with margins steady that supports the forward EPS estimate without any heroics. It would not, by itself, justify a multiple in the top fifth of its history. Growth has to keep surprising to defend the premium, and a merely healthy quarter is a lower bar than the price implies.
The market’s reaction to earnings has been kind so far. The stock moved +4.0% after the July 23 report and +8.8% after April’s, then +0.7% and -2.3% after the two before that. Four reactions, three gains. Yet the shares still trade 11.2% below the 52-week high of $315, and 32% above the low of $211, so the good news has not fully carried the price to a new peak.
What the other gauges say
A stock can look expensive on one measure and ordinary on another, and that is the case here. Before deciding the premium is unjustified, it is worth seeing where each yardstick puts it.
P/E is one lens, and price-to-sales is harsher. The database puts the P/S at 6.6 against a five-year average of 4.9, which is the 96th percentile of its range, and the band tops out at 7.0. Price-to-book, at 8.2 versus 7.9, sits at the 30th percentile, which says the balance sheet is not where the stretch is. Book value is not a good yardstick for a railroad anyway, since the asset base is old track and equipment carried at historical cost.
| Metric | Value | Context |
|---|---|---|
| Price (approx.) | $279.37 | 52-week range $211 to $315 |
| P/E (TTM) | 22.6x | Five-year average 17.7x |
| Price-to-sales | 6.6x | Five-year average 4.9x |
| Analyst ratings | 79% buy, 21% hold | 19 analysts; average target $334 |
| Dividend yield | 1.98% |
The analyst side is bullish without being frantic. Of 19 analysts covering the stock, 79% rate it a buy and the rest hold; none say sell. The average target of $334 sits 20% above the price, the low target of $294 is still 5% above it, and the high of $363 is 30% higher. When even the most cautious analyst has a target above the price, the crowd is leaning one way, and that is a fact about positioning as much as about value. The StockVane quant grade, for what it is worth, is a C.
Positioning tells a slightly different story from the ratings. The most recent short-interest reading, from the end of August, shows shares sold short at 4.7% of float, which is not enough to suggest anyone is fighting the move. The dividend yields 1.98%, with $5.52 paid over the last twelve months, which is a modest cushion for a stock at this multiple; nobody buys Union Pacific here for income alone.
Premium multiples elsewhere in the market rest on the same kind of claim. In Costco at 50 times earnings the claim is membership stability; here it is revenue growth. Either way the multiple is a statement about the future, and it has to be checked against a number that can go wrong.
The price of being wrong
What does a return to the average multiple cost? At 17.7 times the forward EPS of $13.23, the stock would be $234, a fall of 16% from here even if the forward earnings arrive exactly as forecast. That is the downside if the rerating fully reverses, and it is the reason the growth has to be real rather than merely hoped for. The upside case does not need a higher multiple: at today’s 21.1 times forward earnings, 7% EPS growth produces roughly 7% of price return before the 1.98% dividend.
That is not thrilling arithmetic. Compare it with Alphabet, which screens as the cheapest of the large technology names against its own history: there the market is charging less for growth it already sees, and the reward for being right is larger. Union Pacific offers a smaller reward for the same kind of bet. It shows why the premium is a bet on acceleration. A stock at its five-year average multiple can earn its return from steady growth. A stock at the 86th percentile needs the growth line to bend upward to earn the same return.
I am not covering the regulatory calendar, the competitive picture among the eastern carriers, or the labor situation, because the database has no figures on any of them and I would rather leave them out than guess. If any of them turned into a cost or a volume problem, the margin figure above would show it first.
The revenue growth I would want by January
The earnings-report primer on this site lists what to check first. For this stock, three things would make me comfortable with 23 times earnings. Revenue growth staying above 5% for the next two quarters, so the June print is a trend and not an outlier. An EBIT margin holding at or above 42.7%, so growth is not being bought with cost. And the diluted share count still falling, so the EPS line keeps pace with net income.
Miss the first one and the stock is a flat-revenue railroad with a growth multiple. The next report is the test, and the line to read first is quarterly revenue against $6.86 billion: anything below roughly $6.6 billion, about 4% under the June figure, says the jump was timing.
Financial disclaimer: The content on StockVane is for educational and informational purposes only and should not be construed as professional financial advice. Stock market investing involves risk of loss.
Sources: Dividends (SEC Investor.gov glossary) (https://www.investor.gov/introduction-investing/investing-basics/glossary/dividend) · Dividends tax topic (IRS) (https://www.irs.gov/taxtopics/tc404)