
CrowdStrike jumped +20.5% the day after its 2026-08-26 report, against an average earnings-day move of 7.5%. That is roughly three times a normal reaction, and the stock now sits at $238, only 5.1% below its 52-week high of $250 and 177% above the low of $86.
The July 2024 outage that made this company a case study is by now an old story. The title of this post says a year; by the calendar it has been longer than that, and the stock has plainly moved on. What I wanted to test is whether the financials justify the confidence or whether the market is simply paying for a good print. My view: the growth is real and has re-accelerated, the profit line is not there yet, and at 44.7 times sales there is very little room for the profit line to disappoint.
Growth that slowed, then turned
Fiscal-year revenue grew 82% in fiscal 2021, 66%, 54%, 36%, 29% and 22% in fiscal 2026, when it reached $4.8 billion. That sequence is a decelerating curve, which is normal for a company that has multiplied its revenue base 2.1 times since fiscal 2023, when it was $2.2 billion.
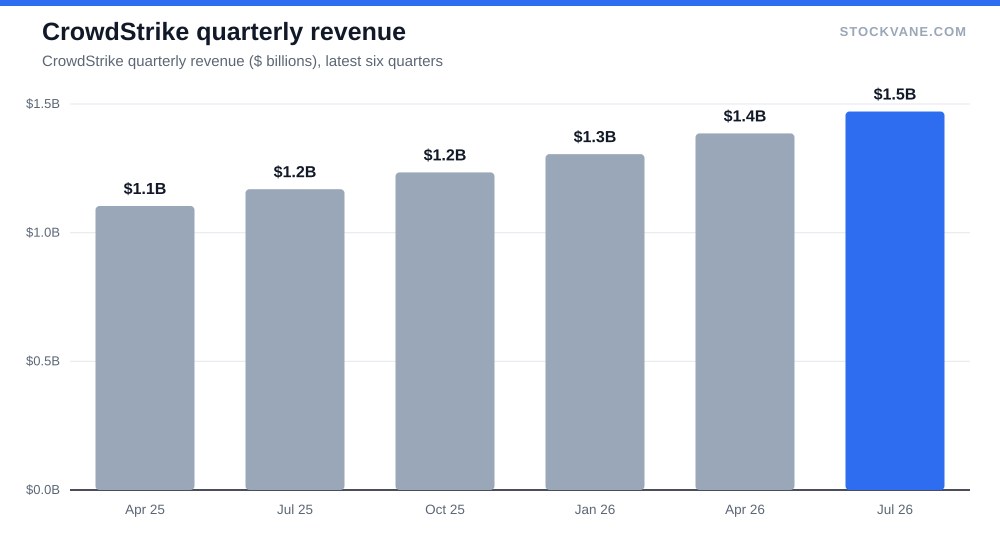
The fiscal 2025 year, which ran through January 2025 and included the outage, still grew 29%. Growth then slowed to 22%, and I would not pin that step down on any single cause without a source that says so. What the quarterly figures show is more interesting: the last four quarters came in at $1.23 billion, $1.31 billion, $1.39 billion and $1.47 billion, with year-over-year growth of 22%, 23%, 26% and 26%. That matters more than the annual figure, because it says the slowdown paused. The rate stopped falling and ticked up. The latest quarter, $1.5 billion, grew 26% and was 6% higher than the quarter before, which puts the annualized run rate at $5.9 billion.
Gross margin has stayed remarkably flat. It was 73.8% in fiscal 2021 and is 74.7% now, down slightly from 74.9% the year before. A company scaling this fast and holding gross margin within a point of where it started tells me the delivery costs are behaving. The problem is further down the income statement.
Profit is the missing line
Reported net income has run -0.09, -0.23, -0.18, +0.07, -0.01 and -0.16 billion dollars from fiscal 2021 to fiscal 2026. One profitable year in six, and the last one widened the loss from $0.01 billion to $0.16 billion, a net margin of -3%.
Operating income tells the same story, with more force. Operating loss was $0.12 billion in fiscal 2025 and widened to $0.29 billion in fiscal 2026, 2.4 times the earlier figure, on 22% more revenue. That gives an operating margin of -6% (operating income over revenue). The database’s separate EBIT margin reads -2.1%, which uses a different definition; I will use the operating-income figure only. The direction is what matters: this company was near breakeven on an operating basis in fiscal 2024 and has moved backward since, even as sales grew.
| Metric | Value | Context |
|---|---|---|
| Price (approx.) | $237.65 | 52-week range $86 to $250 |
| P/E (TTM) | 6253.9x | Five-year average -817.0x |
| Price-to-sales | 44.7x | Five-year average 25.3x |
| Analyst ratings | 86% buy, 14% hold | 35 analysts; average target $250 |
I want to be careful about what I do not know. The data I have does not split the wider loss between stock compensation, higher sales and marketing spend, and any one-off charges, so I cannot say how much of the loss is structural. The reported figures are the reported figures. A reader who wants the adjusted view should go to the company’s own reconciliation.
Reading a P/E of 6,254
The trailing P/E is 6253.9, on trailing earnings per share of $0.04. Those numbers come from a trailing figure that reads slightly positive even though the last fiscal year was a loss, which is why the ratio looks the way it does. It is arithmetic, not information. The five-year average is negative (-817.0) for the same reason, so a comparison with history is meaningless. I ignore both.
Forward P/E is 1372.5 on forward EPS of $0.17, an implied 356% earnings increase. Even if that estimate comes true, the multiple stays above 1,000. Price-earnings is not the tool here.
The valuation tab carries the same gauges. Price to sales is the tool that still works. Current P/S is 44.7, against a five-year average of 25.3, so the stock is at 1.8 times its own history and at the 96th percentile of its range. The industry average is 7.4. Price to book of 47.3 is in the 92nd percentile. On $243.3 billion of market value, each dollar of revenue is priced at roughly forty-five dollars.
That is the same territory I examined in our Palantir valuation piece, where the question was what growth rate a given multiple quietly assumes. The framework carries over. At 44.7 times sales, a buyer needs revenue to keep compounding for years and margins to eventually appear. The stock can be right on the first and wrong on the second, and price would still fall.
What the Street and the flows are saying
Of 35 analysts, 86% rate it a buy and none rate it a sell. The average target is $250, only 5% above the price, with a range from $210 (-12%) to $425 (+79%). When the mean target is within 5% of the price after a 20% jump, the pessimists were forced up and the optimists were left behind. The low target sits 12% below the stock. Even the most bearish analyst is not calling for a collapse.
The quant score moved from C to B in about two weeks. Short interest is 2.4% of float, with about 2.2 days to cover, so a squeeze is not what is driving this. It is worth checking how money moves into and out of a name like this before you act; the method is in how I analyze money flowing in and out of the market.
What four earnings days say
The four most recent reports produced next-day moves of +1.5%, +4.2%, -3.8% and +20.5%. Three of the four sit inside the 7.5% average, and one is nearly triple it. That pattern suggests the August print was not a routine beat. It carried information the market had not priced: the 26% growth in the two most recent quarters, against a prior expectation that the rate would keep sliding. I read the jump as a repricing of the growth path, not a verdict on profits, because the operating loss in the same fiscal year moved the wrong way.
The size of the move also raises the bar. A stock that gains a fifth in a day has used up some of its cushion. The next report will be judged against a higher expectation than the last one, and a quarter that merely repeats 26% could produce a smaller reaction or a negative one.
What each new revenue dollar cost
Here is the test I would apply. Revenue grew from $3.95 billion in fiscal 2025 to $4.8 billion in fiscal 2026, an increase of about $0.86 billion. Over the same year the operating loss deepened by about $0.17 billion. In other words, each extra dollar of revenue arrived with roughly 20 cents of additional operating loss, not with profit. Mature software companies show the opposite: incremental margins above the average margin, because fixed costs are spread over more revenue.
That is a cost-structure question, and the data I have cannot answer it. Costs may be front-loaded, for example by hiring ahead of demand, and it is possible the loss shrinks once the revenue catches up. It is also possible that the business needs heavy spending to keep growing at 20% plus. Both readings fit the numbers. What separates them is the next four quarters of operating margin, and a stock at 44.7 times sales needs the first reading to be right.
The counter-case
The strongest argument for the stock is simple. Revenue re-accelerated to 26%, gross margin is stable near 75%, and the 20.5% earnings-day gain says buyers still have appetite. If this is a franchise that can grow 20% for another three years and then convert to real margins, 44.7 times sales is not crazy, because the dollar of revenue in year four is worth more when it carries a 20% margin.
I am not saying that case is wrong. I am saying the evidence for the second half of it is missing. Nothing in six years of fiscal-year data shows a sustained profit. The one profitable year, fiscal 2024, was followed by two losses.
The 20% growth floor
The number I would watch is quarterly revenue growth against 20%. If the next two quarters stay at or above that, with the operating loss stopping its widening, the multiple can hold. If growth drops below 20% while the operating margin stays negative, a stock at 44 times sales has no earnings floor and no growth premium, and $210 stops being a pessimist’s target. It becomes the level to study.
Financial disclaimer: The content on StockVane is for educational and informational purposes only and should not be construed as professional financial advice. Stock market investing involves risk of loss.
Sources: CrowdStrike SEC filings (EDGAR) (https://www.sec.gov/cgi-bin/browse-edgar?action=getcompany&company=crowdstrike&type=10-K&dateb=&owner=include&count=10).