
Open the list of the 300 largest stocks StockVane covers and count the ones with a foreign address. The answer is 85. Another 214 are U.S.-domiciled. Those 85 names, from Taiwan Semiconductor to Shopify to HSBC, all trade on U.S. exchanges, and together they are worth about $13.6 trillion, roughly 17% of the combined market value of the two groups.
That is a strange fact to sit next to the question in the headline. Most American investors who skip international funds have not skipped foreign companies; many hold several without knowing it, because a single click buys Taiwan Semiconductor or ASML in a U.S. brokerage account. My thesis is that the reasons for skipping international funds are weaker than they used to be: the U.S. listing venue already delivers a foreign slice, and over the last one and three years the median foreign name in that slice has beaten the median U.S. name. That is not a recommendation to rebalance. It is a reason to stop treating the decision as free.
A caveat before any number. StockVane’s database holds only four ETFs (SPY, QQQ, DIA and IWM), all U.S. equity, so I cannot show fund flows, expense ratios or holdings for any international ETF, and I will not pretend to. What I can measure is the performance and size of foreign-domiciled companies that trade in the U.S. That is a proxy for the exposure, not the exposure itself, and it is biased in one important way that I come back to below.
Home bias has a plain explanation
The usual account is that investors prefer what they know, and that is true as far as it goes. Commonly quoted estimates put the U.S. at somewhere around 60% of global equity market value (approximately, and it moves with the dollar and with tech valuations), while surveys of household holdings tend to show a far larger U.S. share. I have no fund-flow data to add to that debate.
There is a second explanation that is less discussed, and it is simply that staying home worked. A U.S.-only portfolio over the last decade and a half did not merely feel safe; it made money, and it did so without currency risk, foreign withholding taxes on dividends or a fund line item nobody could pronounce. An investor who has been paid for a habit for fifteen years does not need a behavioral quirk to keep it.
The question is whether that reward is still arriving at the same rate. In our sample of listed names it is not, at least on medians.
What the median stock did
I took each stock’s month-end price on September 1, 2026 and compared it with September 1 of 2025 and 2023, then took the median within each group. The 214 U.S.-domiciled names gained a median 16.9% over one year and 74.0% over three. The 85 foreign-domiciled names gained 30.9% and 102.7%. Nearly double the one-year figure.
Now the counter-evidence, which I do not want to bury. The average tells a different story. The mean one-year return is 40.7% for the U.S. names and 33.6% for the foreign ones, and I read that as a fatter right tail of extraordinary winners in the U.S. group. If you own a handful of stocks, the mean is the more honest description of your odds of hitting one; if you own a whole market through a fund, the median is a better guide to what the typical holding did. Both facts are true at once.
Breadth points the same direction as the median, though by less. 73% of foreign names rose over the year against 69% of U.S. names. Over three years the two are almost tied, 93% against 92%. So the gap of 13.9 points in the median comes from how far the typical winner climbed, not from many more winners.
The survivorship problem is the bias I promised. These 300 stocks are today’s largest listings. A foreign company that stumbled, shrank and dropped out of the list is not here, while one that rose into it is. That flatters both groups, and there is no reason to think it flatters the foreign group less. Read the medians as a description of the current survivors, not as a backtest of what a fund would have earned.
The foreign slice is not one bet
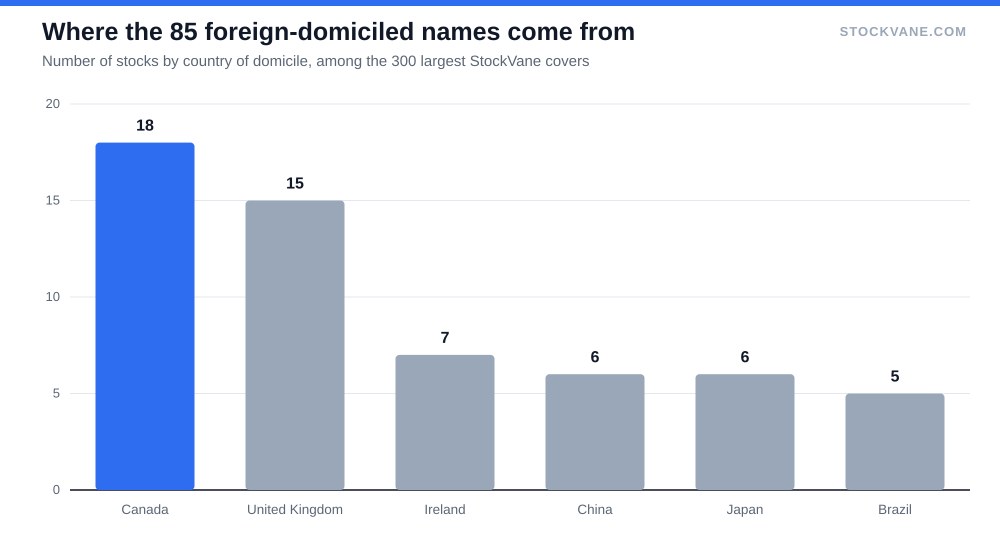
Counting by domicile, Canada supplies 18 names, the United Kingdom 15, Ireland 7, China 6 and Japan 6, with Brazil at 5. That concentration matters for anyone imagining a diversified basket. Canadian banks and energy companies, British banks and consumer staples, and a group of Chinese internet and chip names do not move together.
Domicile is also a legal address, not a map of revenue. The seven Irish-domiciled names, which include Accenture and Medtronic, have an Irish address on paper; the database says nothing about where they sell. If I strip Ireland out, the foreign medians barely change (33.1% over one year and 103.9% over three), so the result does not hinge on that quirk.
The range inside the group is the stronger warning. ASE Technology (ASX) gained 279% in a year. Sea Limited (SE) lost 43%. That is a spread of 322 points between the best and the worst, and it is why a fund matters: one stock in this group is a bet on a country, a sector and a currency at once. Alibaba (see its financials) fell 36% over the same year, while Taiwan Semiconductor (financials) rose 57%.
| Stock | Domicile | Market value ($B) | One-year price change | Rank by market cap |
|---|---|---|---|---|
| Taiwan Semiconductor (TSM) | China | 2,247 | +57% | 7 |
| ASML Holding (ASML) | Netherlands | 652 | +75% | 20 |
| HSBC Holdings (HSBC) | United Kingdom | 362 | +50% | 35 |
| Royal Bank of Canada (RY) | Canada | 285 | +42% | 46 |
| Arm Holdings (ARM) | United Kingdom | 283 | +95% | 47 |
| Shell (SHEL) | United Kingdom | 277 | +37% | 48 |
| Alibaba (BABA) | China | 272 | -36% | 50 |
| Mitsubishi UFJ Financial Group (MUFG) | Japan | 269 | +48% | 52 |
| Novartis AG (NVS) | Switzerland | 261 | +13% | 54 |
| AstraZeneca (AZN) | United Kingdom | 248 | +10% | 57 |
| SAP SE (SAP) | Germany | 238 | -20% | 60 |
| Toyota Motor (TM) | Japan | 235 | +2% | 62 |
Three of the foreign names sit in the top forty by market value: Taiwan Semiconductor (seventh), ASML (twentieth) and HSBC (thirty-fifth). ASML alone is a business we examined in some depth in our ASML piece, and its 75% one-year gain shows what a concentrated foreign holding can do for a portfolio when it works.
The losers deserve a paragraph of their own. Some 27% of the foreign names fell over the year, and the list is not random. Sea Limited, PDD, Alibaba, HDFC Bank and RELX all sit at the bottom, down between 28% and 43%. Those names span Southeast Asia, China, India and Britain, so there is no single regional story hiding in the tail. An investor who bought foreign exposure by picking three or four familiar ADRs could have landed on either end of a range that wide, which is exactly the argument for a diversified vehicle and against improvising one from a brokerage screen.
Size matters too. The foreign group is worth $13.6 trillion against $66.9 trillion for the U.S. group, and those totals count every share class of a company separately, so they overstate a little. Even so, a fund that mirrored this split would put about 17 cents of each dollar abroad. That is a number a U.S. investor can compare with whatever their own foreign allocation is today, and for many the honest comparison is zero against seventeen.
Why this does not prove that funds are the answer
Here is the fair reading of everything above. A foreign stock listed in New York is not an international ETF, and the data here cannot tell you what an ETF with hundreds of holdings, its own currency exposure and a different mix of banks, industrials and consumer names would have returned. Most of the biggest winners in my list are semiconductor or technology names that a U.S. investor already owns through domestic funds. A broad international fund would hold a great deal that never appears in this sample.
Currency is the other piece I cannot see. Foreign shares that trade in dollars through the U.S. listing carry a currency effect that is baked into the price; a fund that holds local-currency shares carries a similar one. Neither is in this dataset as a separate line.
What I can say with evidence is narrower. Skipping international funds felt costless for a long time. On the measure I can compute, that assumption looks weaker now than it did.
Where to look if you want to check this yourself
A screener with a country filter will produce the same list in minutes; our screener roundup covers several that support it. Sort the foreign names by market value and read their five-year revenue, not the year’s price move. The names with steady revenue and a modest valuation are more informative than the ones that tripled.
I would also look at the stocks that dropped out of the U.S. survivors’ list. That is where the honest comparison lives, and it is a data set this article does not have.
Skipping it is also a position
The median foreign name beat the median U.S. name by 13.9 points over one year and by 28.7 points over three. A gap that widens as the window lengthens is not a one-quarter accident. It is also drawn from survivors, from listings rather than funds, and from a sample where one Taiwanese chip packager returned 279%.
So the position I would take is modest. Owning no foreign exposure is a choice, and it deserves a sizing decision rather than a default.
The number to watch is the one-year median gap, now 13.9 points. If it drops under 5 while the U.S. median holds near 17%, the outperformance was a single-year event and skipping looks cheap again. If it stays above 10 through the next annual comparison, zero foreign exposure is a bet on the U.S. and should be sized like one.
Financial disclaimer: The content on StockVane is for educational and informational purposes only and should not be construed as professional financial advice. Stock market investing involves risk of loss.
Sources: Dividends (SEC Investor.gov glossary) (https://www.investor.gov/introduction-investing/investing-basics/glossary/dividend) · Dividends tax topic (IRS) (https://www.irs.gov/taxtopics/tc404)