
Put $10,000 into Verizon at $48 and you own about 208 shares. Those shares pay roughly $580 a year at the trailing dividend of $2.79 per share, a yield of 5.81%. Nothing in that arithmetic is hard. The hard part is deciding whether the $580 is a stable income stream or a slowly melting one, because the yield alone cannot tell you.
I think it is the first, with a condition. My view is that Verizon’s dividend is well covered by earnings, that the profit base under it stopped shrinking in 2024, and that the stock is no longer cheap enough to forgive a second stumble. That last part is where most of the risk sits.
The coverage is better than the yield suggests
Start with the reassuring number. Verizon earned $4.06 a share on a diluted basis in fiscal 2025, against $2.79 of dividends over the trailing twelve months. That is a payout of about 69%. On trailing earnings of $3.84, the ratio rises to 73%, and on the $4.72 forward estimate it falls to 59%. Three different denominators, a range of roughly 59% to 73%. Even the worst of them leaves about a quarter of earnings unpaid out.
Compare that with what a stretched payout looks like. In our screen of the highest yields against dividend growth, the names that worried me were the ones where dividends exceeded earnings or sat right on top of them. Verizon is not in that group. A company can pay out 70% of earnings for a long time if earnings hold still.
Do they? That is the question the next section answers.
The profit history is the real risk
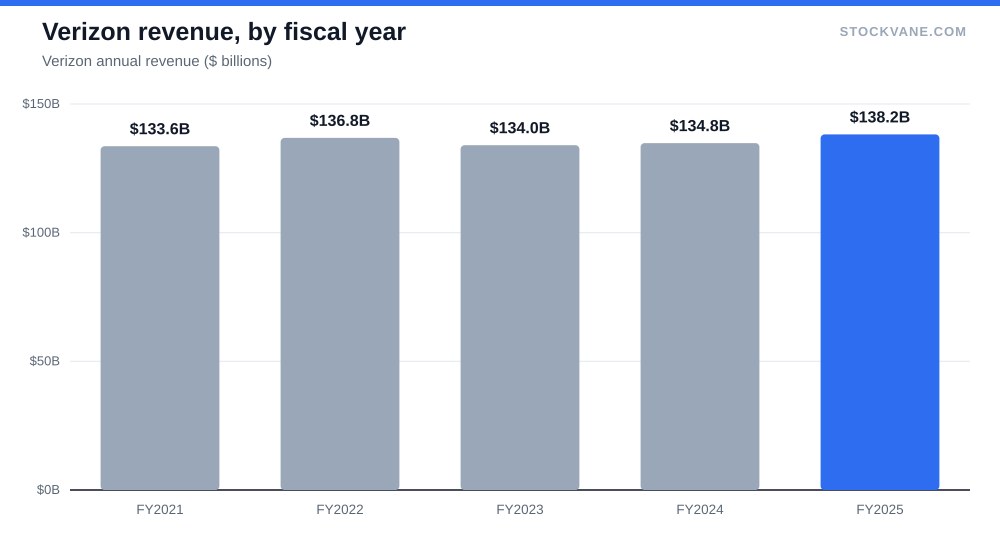
Revenue has been dull and steady. It was $136.8 billion in 2022, $134.0 billion in 2023, $134.8 billion in 2024, and $138.2 billion in 2025, up 3% on the year. Operating income moved in an equally narrow band, from $30.5 billion in 2022 to $29.3 billion in 2025. On those two lines, this is a business that barely moved.
Net income did move.
Net profit fell from $21.75 billion in 2022 to $12.10 billion in 2023, a drop of 44%, then recovered to $17.95 billion in 2024 and $17.61 billion in 2025. The 2023 hole did not come from the operating line, which was $28.7 billion that year, only $1.8 billion below 2022. Something below operating income took roughly $9 billion out of net income, and the financials tab shows the annual statements if you want to trace it. I would not guess at the cause from here. I would only note that operating margin dropped to 16.8% on the DB’s EBIT measure in 2023 and returned to 22.0% in 2024, so the problem was a single year, not a trend.
Even so, profit in 2025 was still about 19% below the 2022 level, and diluted EPS of $4.06 compares with $5.06 three years earlier. A dividend that costs 55 cents on each dollar of 2022 earnings costs 69 cents today. That is the cushion shrinking, quietly, while the yield holds still.
| Fiscal year | Revenue ($B) | Operating income ($B) | Net income ($B) | Diluted EPS | Gross margin |
|---|---|---|---|---|---|
| 2020 | 128.3 | 28.8 | 18.35 | $4.30 | 60.1% |
| 2021 | 133.6 | 32.5 | 22.62 | $5.32 | 57.9% |
| 2022 | 136.8 | 30.5 | 21.75 | $5.06 | 56.8% |
| 2023 | 134.0 | 28.7 | 12.10 | $2.75 | 59.0% |
| 2024 | 134.8 | 28.7 | 17.95 | $4.14 | 59.9% |
| 2025 | 138.2 | 29.3 | 17.61 | $4.06 | 58.9% |
The table makes the point without adjectives. Revenue sits within a $5 billion band across the six years, and operating income within about $4 billion. The swings live below the operating line and in per-share results. If you owned the stock for the 2023 drop, you already know this.
What the stock price already assumes
Verizon trades at $48, 6.9% below its 52-week high of $52 and 32% above the low of $37. The market value is $199.8 billion. The trailing P/E is 12.5. Against the five-year average of 10.6, that is a premium of about 18%. The valuation history on the valuation tab puts the current multiple at 13.4, the 80th percentile of its own five-year range of 7.5 to 13.7.
So the stock is expensive relative to its own past and yet cheap relative to almost anything else: the industry average P/E in the same series is 11.2, and the price-to-sales ratio of 1.5 sits at the top of a narrow 1.2 to 1.5 band. Those two facts do not contradict each other. A telecom that grows revenue at 1% to 3% does not deserve a growth multiple, and it does not get one. What it gets is a slightly higher multiple than usual because the market has stopped fearing another 2023.
That matters for a yield buyer in one specific way. The 5.8% dividend yield exists because the multiple is low. If the P/E rerated back to its five-year average of 10.6 on unchanged earnings, the price would fall to about $41, and the yield would rise. You would have lost about 15% of principal and gained a fatter yield on what remains. That is a lousy trade if you bought for safety.
Analysts are not pricing in much upside either. Fourteen cover the stock: 36% rate it a buy and 64% a hold, with none at sell. The average target is $50, 4% above the current price, and the range runs from $45 to $56. The low target sits 6% under the price and the high target 16% over it. A 4% average gap on top of a 5.8% yield gives an implied total return near 10% if targets are right, which is decent for a utility-like holding and no more than that.
Where the growth would come from
It probably won’t come from revenue. The latest quarter brought in $34.3 billion, down 1% from a year earlier, and the run rate of about $137.0 billion sits close to the fiscal 2025 total. Consumer accounts for $26.2 billion of that quarter, or 77%, and Business for $7.2 billion, or 21%. It is a consumer subscription company with a smaller enterprise arm attached.
Gross margin slipped from 59.9% to 58.9% last year. Operating margin held near 21%. Net margin is 13%. These are respectable margins for a business this size, and none of them is rising.
The earnings growth in the forward numbers is a different story. Forward EPS of $4.72 against trailing $3.84 implies about 23% growth. That is a large number for a company whose sales barely move. I read it as a rebound in per-share profit toward the 2021 level of $5.32, and a rebound is only worth paying for once it appears in a reported quarter. Until then the forward P/E of 10.2 looks cheaper than the trailing number for reasons that have not yet been earned.
The counter-case, and the debt behind the dividend
The best argument against my view is simple. A company that lost 44% of its net income in one year can do it again, and a 69% payout offers less protection than it appears if the shock is that large. At the 2023 level of $2.75 in diluted EPS, the same dividend would have been more than the company earned: a payout of about 101%. The cash actually paid out did not shrink: dividends paid were $11.0 billion in 2023, $11.2 billion in 2024 and $11.5 billion in 2025, so the payment held through the year the profit fell. It shows how thin the margin becomes when a one-time hit lands.
I have no evidence in hand that another hit is coming. I also cannot rule it out from these numbers. The check I trust is the annual statement sequence: if operating income slips below roughly $28 billion while net income is falling too, the picture changes.
Now the debt, which the headline promised. Verizon’s debt and lease obligations stood at $158.5 billion at the end of 2025, against $157.7 billion in 2023 and $141.3 billion in 2024. That is about nine times the $17.61 billion of net income and eight times the $19.7 billion of free cash flow. Dividends took $11.5 billion of that cash flow, or 58%, and what remained did not bring the debt down: after net repayments of $2.0 billion in 2023 and $4.8 billion in 2024, the company borrowed a net $7.8 billion in 2025. Capital spending of $17.0 billion is what keeps free cash flow from being larger, and it is the number I would watch, because a network that has to keep spending at that rate leaves only about $8 billion a year after the dividend to reduce borrowing. So the dividend looks safe in the sense that cash covers it 1.7 times, but the balance sheet gives it little room to grow faster than earnings. What I have not measured is the interest cost, because the data here does not break it out cleanly, and I would not lean on the payout ratio alone without it.
Two small market signals point the same direction. Short interest is 2.0% of the float, which is low and suggests nobody is betting on collapse. The quant grade improved from D to C in the last few weeks, which is an improvement but not an endorsement. And the last report on 2026-07-24 moved the stock +5.8%, against an average earnings-day move of 5.4%, so the reaction was normal, not euphoric.
The dividend line I would hold it to
The number I would watch is diluted EPS in the next annual report. Verizon needs to clear roughly $4.06 again, and I would want to see it move toward the $4.72 the forward estimate implies rather than settle at $3.84. If reported EPS lands below $3.84, the payout crosses 73% and the case for owning this at 12.5 times earnings gets weaker. If it lands above $4.50, the payout drops toward 62% and the 5.81% yield starts to look like a bargain again. Below $3.84 I would stop calling it well covered. Above $4.50 I would call it cheap.
Financial disclaimer: The content on StockVane is for educational and informational purposes only and should not be construed as professional financial advice. Stock market investing involves risk of loss.
Sources: Dividends (SEC Investor.gov glossary) (https://www.investor.gov/introduction-investing/investing-basics/glossary/dividend) · Dividends tax topic (IRS) (https://www.irs.gov/taxtopics/tc404)