
Can a business that supplies 46% of a company’s reported segment sales still be called quiet? Corning’s optical communications unit booked 2.07 billion dollars last quarter, and its stock closed at $150 on September 18, up 90% from the $78.93 it fetched a year earlier. Quiet was the right word in 2025. It is the wrong one now, and the interesting question has moved from “is fiber an AI story” to “how much of that story is already in a $129.3 billion market value”.
I pulled the numbers to answer it. The business evidence is better than I expected. The price evidence is harder to defend.
My view: Corning’s fiber franchise really is an AI-infrastructure exposure, and the 2025 profit rebound proves the earnings side of that. But at 69.2 times trailing earnings and 7.4 times sales, the stock has already paid for two more years of growth than the reported numbers can show, and September has just demonstrated how thin the cushion is.
What the segment table says
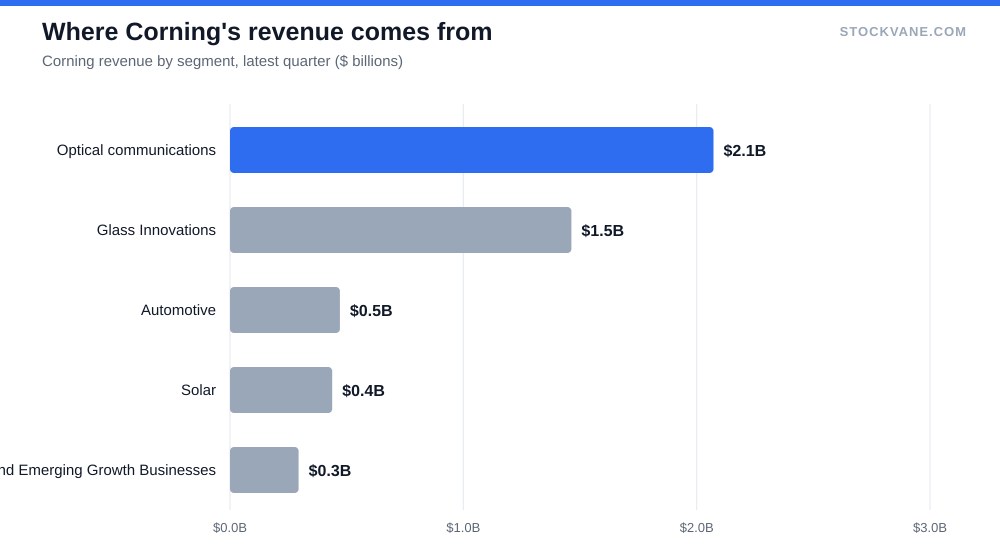
The latest segment breakdown, for the second quarter of fiscal 2026, is the cleanest evidence for the title. Optical communications was $2.072 billion, which the database records as 46% of the segment total. Glass Innovations, the display and specialty glass business most people picture when they hear the name, was $1.46 billion, or 32%. Automotive brought in $0.47 billion (10%), Solar $0.44 billion (10%) and Life Sciences and emerging businesses $0.29 billion (7%). A negative $0.23 billion adjustment for hedged exposures brings the total down to the $4.5 billion of reported revenue.
That makes optical the largest segment by a margin of about $0.6 billion over the second one. Two years of segment history would tell me how fast it grew, but the database holds only this one quarter of segment detail, so I cannot say the unit is “growing 30%” or anything like it. What I can say is what the mix looks like today and that overall revenue rose 17% year over year in the same quarter, with a 9% sequential gain. Annualized, that quarter is a $18.0 billion run rate.
Is optical an AI trade? The segment sells fiber and connectivity hardware. Whether a given kilometer of cable ends up inside a data center or under a suburban street is not something a financial database records, so the link is my inference. It is a reasonable one. On September 8, a headline reported that Verizon and Corning had signed a multi-billion-dollar fiber-optic agreement described as expanding broadband and building AI infrastructure. That is a customer announcement, not a revenue figure, and I would not model it as one. It does show that the buyers are describing their own purchases in AI terms, which is the part of the thesis I can source.
The margin line, corrected
An older version of this argument leaned on “the fastest revenue growth in the window”. That was wrong, and I would rather say so. Revenue rose 25% in fiscal 2021 from $11.30 billion to $14.08 billion. Fiscal 2025’s 19% rise, from $13.12 billion to $15.6 billion, is the second fastest of the six years.
The rebound in profit is the stronger claim. On the financials page, operating income was $0.51 billion in 2020 (a 4.5% margin), $2.11 billion in 2021 (15.0%), then slid to $0.89 billion in 2023 (7.1%) as electronics demand cooled. In fiscal 2025 it came back to $2.28 billion, a 14.6% margin. The database’s own EBIT margin is 15.3%, a slightly different construction; I use the operating-profit figure throughout and flag that the two differ by less than a point.
Gross margin tells the same story in a cleaner way, because it moves less with one-off items: 32.6% in fiscal 2024, 36.0% in fiscal 2025. A gain of 3.4 points on a $15 billion revenue base is worth roughly half a billion dollars of gross profit that would not exist at the old margin. Diluted EPS went from $0.58 to $1.83, a 3.2-fold increase, and net income from $0.6 billion to $1.7 billion.
Notice what this does and does not prove. Margins are back at the 2021 peak level, not above it: 14.6% against 15.0%. The five-year record says Corning earns 15% in good years and 7% to 9% in bad ones. A rebound to the old peak is a recovery. Only a margin that holds above it would be a new business.
A stock that went from $79 to $255 and back to $150
Here the price data becomes the story. The closes I pulled: $78.93 on September 18, 2025, $87.10 at the end of 2025, $135.51 on March 31, $254.95 on June 30. The highest close in the database is $255.21, at the end of June. Since then the stock has lost 41% from that close, and 44.7% from the intraday 52-week high of $271.
I do not want to overstate the reversal. The stock is still 97% above its 52-week low of $76. Anyone who owned it a year ago is sitting on a gain of 90%. But the shape matters for anyone thinking of buying today: the last twelve months contained a tripling and a 41% drawdown, so the position sizing that works for a “boring glass company” does not.
Two events did much of the damage, and both are in the record. On July 28, the day of the second-quarter report, the shares fell 12.1% (from $143.09 to $125.77) even though revenue grew 17%. Corning’s average earnings-day move is 7.3%, so that reaction was nearly twice the norm. Then on September 14 the shares dropped from $166.40 to $143.60, a 14% one-day fall. The headline attached to it says Corning planned to raise up to $2 billion through a secondary stock offering, and that AI chip stocks were falling broadly that night.
A $2 billion raise is about 1.5% of the $129.3 billion market value, so the dilution itself is small. The drop was much larger than the dilution. My read is that the market was reacting to the signal: a company that needs outside capital to build capacity, in a week when the whole AI hardware group was sliding, is a different proposition from one funding growth out of cash flow. I cannot prove that from the data. I can say that the stock has recovered only about 30% of that day’s loss since, closing at $150 against $166.40 the Friday before.
What you are paying
The valuation tab shows trailing P/E at 69.2, with the five-year average at 61.8. That is only slightly above history on earnings, which sounds reassuring until you notice that trailing earnings of $2.17 are the trough-to-peak rebound year. Sales are where the stretch shows: price to sales is 7.4 against a five-year average of 3.4, and above the top of its own five-year band of 1.2 to 5.6. Price to book is 10.0 against 4.2.
| Metric | Value | Context |
|---|---|---|
| Price (approx.) | $150.13 | 52-week range $76 to $271 |
| P/E (TTM) | 69.2x | Five-year average 61.8x |
| Price-to-sales | 7.4x | Five-year average 3.4x |
| Analyst ratings | 70% buy, 30% hold | 10 analysts; average target $189 |
| Dividend yield | 0.75% |
Forward numbers soften the picture. Analysts’ forward EPS of $3.67 implies a 40.9 multiple and 69% earnings growth from the trailing figure. If that arrives, the stock is priced at a level that fits a strong grower. If it arrives at half that pace, the multiple stays above 50.
The Street is not shy. Ten analysts cover the name (the forecast page lists them), 70% rate it a buy, and the average target is $189, 26% above the current price. The range is wide: $129 at the bottom (-14% from here) and $220 at the top (47%). Citi and Oppenheimer targets in early September, at $220 and $200, and Mizuho’s cut to $180 on September 14 all show the spread. Short interest is low at 2.3% of float, so nobody is betting heavily against it. The quant model on our site moved from a C rating on September 14 to a B in the latest reading.
The dividend is a footnote: $1.12 a share, a 0.75% yield. It will not carry a holder through another 40% drawdown.
For comparison with other AI-hardware valuations, our earlier look at ASML argued that a great semiconductor business can still be hard to time, and Oracle’s story in the backlog piece is a similar test of how much future demand a price can absorb. Corning belongs in that conversation, with a shorter record of earning these margins.
The counter-case I take seriously
The best argument against my caution is the growth rate. Revenue is up 17% in the latest quarter, 19% in the year, and the quarterly sequence has been 21%, 20%, 20%, 17%. A company compounding that fast at a 36% gross margin can grow into a $129.3 billion valuation more quickly than a static multiple suggests. If optical really is 46% of sales and expanding at the pace the customer announcements imply, then margins could widen past 2021’s 15.0%, and the current price would look cheap in retrospect.
The number that shows the decline in that momentum is the growth sequence itself. It has drifted down from 21% to 17% over four quarters. That is still fast, but it is slower every period, and the multiple assumes it is not.
The other piece I am not covering is Corning’s competitive position: whether its fiber share is rising or merely holding. The database has no market-share data, and without it I will not pretend to know whether Corning is winning or the whole market is expanding beneath it.
The print that would break the story
I would not call the stock a sell at $150. A 26% gap to the average target and a business that earned a 14.6% operating margin last year are real. But I would size it as a volatile position, not a compounder, and I would want a smaller weight than the 90% one-year gain tempts me to hold.
The test is the next quarterly report. Revenue growth has to stay at or above 15% year over year, and gross margin must hold at or above 36.0%. If growth falls under 15% while a $2 billion equity raise is being absorbed, the multiple has nothing under it. If both hold and optical’s share of segment sales edges above 46%, then the title is right, and I will have been too cautious about a very good business.
Financial disclaimer: The content on StockVane is for educational and informational purposes only and should not be construed as professional financial advice. Stock market investing involves risk of loss.
Sources: Dividends (SEC Investor.gov glossary) (https://www.investor.gov/introduction-investing/investing-basics/glossary/dividend) · Dividends tax topic (IRS) (https://www.irs.gov/taxtopics/tc404)