
AT&T paid $2.08 a share in 2021. It paid $1.35 in 2022, and $1.11 in every year since. Between the second and third figure sits the cut that ended one of the longest dividend-growth records in American telecom, and it cost holders of the old $0.52 quarterly payment 47% of their income overnight.
That history is why so many income investors still refuse to look at the stock. I understand the instinct. A dividend that has been cut once has proven it can be cut. But the useful question is whether the smaller payout that replaced it is set at a level the business can carry, and that is a question with numbers behind it. My answer is a qualified yes: the new dividend is covered roughly 2.4 times by free cash flow, absorbs 37% of trailing earnings per share, and has not moved in three and a half years. It is durable because it is small. Nobody should mistake it for a growing one.
What the payout absorbed before and after
The first thing to know is the size of the check. In 2021, AT&T paid $15.1 billion in cash dividends. In 2025 it paid $8.2 billion, a reduction of 46%. Over the same span, free cash flow went from $26.4 billion to $19.4 billion. So the payout that used to consume 57% of free cash flow now consumes 42%.
| Metric | Value | Context |
|---|---|---|
| Price (approx.) | $25.40 | 52-week range $20 to $29 |
| P/E (TTM) | 8.4x | Five-year average 13.4x |
| Price-to-sales | 1.4x | Five-year average 1.2x |
| Analyst ratings | 69% buy, 25% hold | 16 analysts; average target $29 |
| Dividend yield | 4.37% |
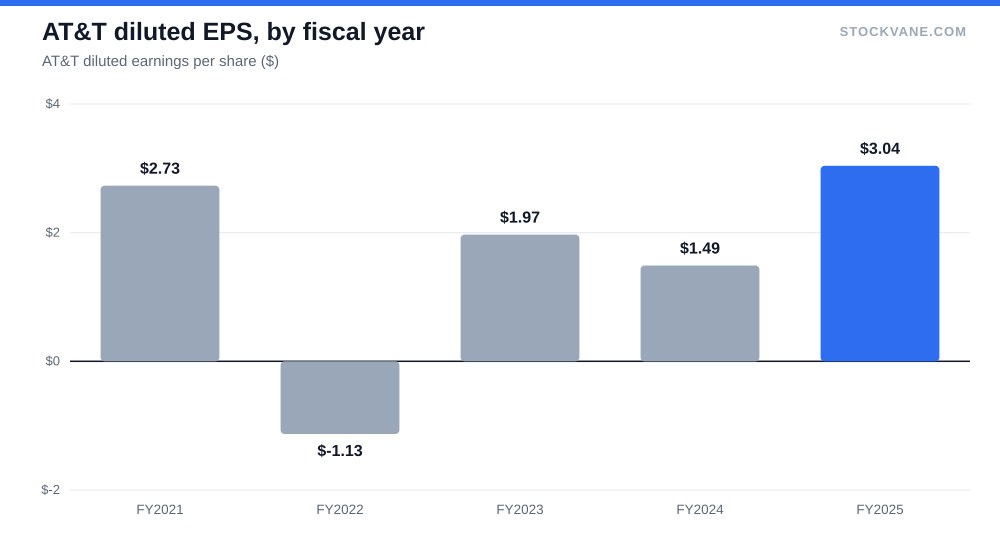
Look at the coverage column. In 2021 the cash cover was 1.75x, which sounds comfortable until you note the earnings side: a diluted EPS of $2.73 against a $2.08 dividend, a 76% payout. In 2024 the company earned $1.49 a share and paid $1.11, a 74% payout that looks tighter than any year since the cut. Free cash flow that year was $18.5 billion, 2.3 times the dividend, which is why the earnings figure alone can mislead here. Accounting charges move EPS around. Cash paid out and cash earned do not.
2022 shows why. Diluted EPS was negative $1.13, a loss the payout ratio cannot express, yet free cash flow of $12.4 billion still covered the $9.9 billion of dividends paid 1.3 times. The company lost money on paper in the year it cut, and it could have afforded the old dividend in cash for a while longer. So the cut was a decision about the balance sheet more than a forced move, and I would read it as management choosing to spend the money elsewhere. That reading is an inference; the DB does not carry management’s stated reason.
The cash the dividend competes with
A dividend is never the only claim on free cash flow. AT&T spent $20.8 billion on capital expenditure in 2025 against $40.3 billion of operating cash flow, which is where the $19.4 billion free cash flow comes from. The cash flow statement shows how much of the operating line the network build absorbs. Roughly half.
That matters because fiber and wireless spending is the reason the company can defend its revenue. Sales were $125.6 billion in 2025, up 3% from $122.3 billion, and up from $120.7 billion in 2022. Growth of 3% a year is slow, and I would not pay for it. But it is positive after the declines of 2020 to 2022, and the last quarter’s $31.6 billion was up 2% again.
Debt is the other claim. Long-term debt stood at $127.1 billion at the end of 2025, down from $151.0 billion at the end of 2021. That is a reduction of $24 billion, and it happened while the dividend was being paid. A company that can pay down debt and hold a dividend has room. A company that has to choose between the two does not.
Earnings quality, and the number I distrust
Now the counter-case, taken head-on. FY2025 net income was $23.4 billion, nearly double the $12.3 billion of 2024, and diluted EPS of $3.04 more than doubled from $1.49. That is the figure behind the 37% payout above, and I do not think it is the right one to anchor on.
Net income of $23.4 billion is also close to operating income of $25.0 billion. For a company carrying more than $127 billion of long-term debt, interest expense alone should put net income well below operating income. When it does not, one-time items are usually the reason, and the year-over-year doubling is what those look like. My read is that 2025 earnings are flattered.
The forward number tells the same story. Analysts’ forward EPS is $2.24, about 26% below the trailing figure, and against that the dividend absorbs 50%. That is healthier than 2024’s ratio and higher than the 36% headline. If forward EPS is right, the payout is about half of earnings. To argue the payout is unsafe on earnings, you need EPS to fall below the $1.11 dividend itself, a drop of more than half from that forward figure.
The chart above shows why I distrust one year of earnings. Net profit ran from a loss of $7.05 billion in 2022 to $15.62 billion, $12.25 billion, and then $23.39 billion. Three of the four swings are large enough that any single year is a poor guide to the next. Free cash flow, by contrast, stayed between $12.4 billion and $20.5 billion after 2021 and never moved as violently. That stability is the strongest evidence for the durability claim in the title.
There is a second reason cash matters more here than for a typical company. Depreciation on a network runs high, and acquisition accounting adds amortization on top. Those charges depress reported earnings without touching cash. When a company like this reports a payout ratio of 75% on EPS and 45% on cash, I take the lower number more seriously, though not blindly, because capital spending is a real and recurring cost.
What the market pays for it
The stock is at $25.40, 11.6% below its 52-week high of $29, yielding 4.37%. On trailing earnings the P/E is 8.4, against a five-year average of 13.4; on the valuation page the forward P/E is 11.3, roughly matching the industry average of 11.2. Price-to-book is 1.7 against a five-year average of 1.3. So the stock looks cheap on trailing earnings and ordinary on forward ones, and the price-to-book ratio sits at the top of its five-year band.
Analysts are moderately positive. Of 16, 69% rate it a buy, with a mean target of $29, 14% above the price. The lowest target is $20, which is 21% below where the stock trades. StockVane’s quantitative score for the stock is D, unchanged from earlier this month, and that is worth taking seriously: it does not fit with a story of strong momentum.
Put the yield in context. At 4.37%, a holder of 1,000 shares receives about $1,110 a year. The market is not pricing a collapse. It is pricing a utility-like income stream with no growth, and that is roughly what the dividend history shows: $1.11 in 2023, $1.11 in 2024, $1.11 in 2025, and $0.83 across the first three payments of 2026.
Short interest is 1.8% of float, low. The last earnings report, on 2026-07-22, moved the stock +3.5%, a little above the average earnings-day move of 2.6%. This is not a stock that trades on surprises.
Where the revenue comes from
The latest segment table shows how concentrated the business has become. Advanced Connectivity, the fiber and wireless core, produced $28.6 billion, or 90.7% of quarterly revenue. The legacy business, the copper and older services that used to define a telephone company, was $1.63 billion, or 5.2%. Latin America was $1.22 billion.
That split explains the durability argument more than any ratio. A dividend supported by a business in structural decline is a melting ice cube. One supported by a business that is 91% subscription-style connectivity revenue is a different thing. The legacy piece still shrinks, and it will keep pulling total growth down by a small amount each year, but at 5% of sales it no longer decides the outcome.
For income investors deciding between a payout like this and a growing one, our comparison of high dividend yield versus dividend growth lays out the trade. AT&T is the yield side: 4.37% now, with a dividend that has not risen since the reset.
The two lines that would break the case
The next report is on October 21. Two numbers matter on it, and neither is the EPS headline.
The first is free cash flow. The dividend is covered 2.4 times on the 2025 figure. If full-year free cash flow drops below roughly $12 billion, the level of 2022, cover would be near 1.5 times and I would revisit. The second is long-term debt. It has fallen from $151 billion to $127 billion, and I would want that number to stay below $130 billion. A reversal would say the company is borrowing to maintain something it can no longer fund.
If neither line breaks, a $1.11 dividend against $3.02 of trailing EPS and about $19 billion of free cash flow is not a payout I expect to see cut again.
Financial disclaimer: The content on StockVane is for educational and informational purposes only and should not be construed as professional financial advice. Stock market investing involves risk of loss.
Sources: Dividends (SEC Investor.gov glossary) (https://www.investor.gov/introduction-investing/investing-basics/glossary/dividend) · Dividends tax topic (IRS) (https://www.irs.gov/taxtopics/tc404)