
Take a portfolio that starts the year at 60% stocks and 40% bonds. The S&P 500 fund SPY sits 21.7% above its 52-week low of $626.11. If the bond half did nothing over the same stretch, the stock half would now be 65.1% of the portfolio, not 60%. Nobody chose that allocation. It happened while the owner was not looking.
That drift is the problem with the phrase “60/40 is dead”, and it is also the reason I do not think the phrase is right. The 60/40 label describes a starting point, not a strategy. What has aged is how people build each half and how often they check it.
My argument is this: the 60/40 idea survives, but the equity half no longer behaves like one asset, the bond half is the piece nobody can vouch for from the equity data alone, and the update that matters is a written rebalancing rule, not a new split. The evidence below comes from StockVane’s September 18, 2026 snapshot of four index funds and 295 stocks. It cannot tell you about bonds, and I will say so where it matters.
What the equity half looks like today
Start with the index funds, because that is what most 60/40 accounts hold. On September 18, SPY closed at $761.69, 2.0% below its 52-week high of $777.44. The Dow fund DIA was 5.4% below its high, the Nasdaq-100 fund QQQ 3.5%, and the small-cap fund IWM 6.7%. By that measure the equity leg is healthy and near its peak.
Now the stocks underneath. Of the 295 stocks in our coverage with a price range on file, the median sits 12.8% below its own 52-week high. 194 of them are at least 10% below it, and 89 are at least 20% below. The index says the market is 2% off the top. Nearly a third of the individual stocks say they are in a bear market. Both statements are true, because a handful of very large companies carry the index weights.
I read that gap as the first reason the old label needs an update. A 60% stock allocation held through an index fund is a bet that the large companies keep pulling the average up. That was fine for years. It is a narrower bet than it looks, and an investor who reads “60% stocks” as “60% spread across the economy” is under-counting the concentration.
There is a second way to see the same thing. Over the past 52 weeks, the distance from low to high was 24.2% for SPY, 21.9% for DIA, 34.3% for IWM and 34.7% for QQQ. That tells you what the stock leg has been willing to do in a single year. It swung more than 20% peak to trough in every one of the four, and more than a third in the Nasdaq and small-cap funds.
| Fund | Price | 52-week high | 52-week low | Below high | Low-to-high range |
|---|---|---|---|---|---|
| SPY | $761.69 | $777.44 | $626.11 | 2.0% | 24.2% |
| DIA | $515.88 | $545.04 | $447.25 | 5.4% | 21.9% |
| QQQ | $721.45 | $747.83 | $554.99 | 3.5% | 34.7% |
| IWM | $284.10 | $304.38 | $226.60 | 6.7% | 34.3% |
How drift changes the portfolio you own
Here is the arithmetic, and it is only arithmetic. Suppose stocks rise by SPY’s low-to-high range of 24.2% and bonds are flat. A $100 portfolio at 60/40 becomes $114.5, and the stock share becomes 65.1%. The investor is now 5 points more aggressive than planned, right at the point where equity risk looks cheapest.
Reverse it. A 20% stock decline with flat bonds takes the portfolio down 12.0% and leaves the stock share at 54.5%. Now the owner is more conservative than planned, having sold nothing, and is tempted to stay that way. Rebalancing means buying stocks after they fall and trimming them after they rise. That sounds obvious and feels wrong in both directions.
None of that is new. The reason it matters more now is what the last section showed: the equity half is more concentrated, so a drift into it is a drift into a narrower group of companies. A Fed that is stuck between inflation and growth is the sort of shock that reaches both halves at once, and our guide on why the Fed’s bind catches stock portfolios covers that side. The September rate hike is a related case, covered in The Fed Hiked on September 16.
The bond half is the part I cannot measure
This is where I have to draw the line. The StockVane database holds stocks and four equity index funds. It has no bond funds, no Treasury yields and no return history for fixed income, so I cannot show you whether stocks and bonds have recently fallen together. Anyone who tells you the answer from equity data is guessing.
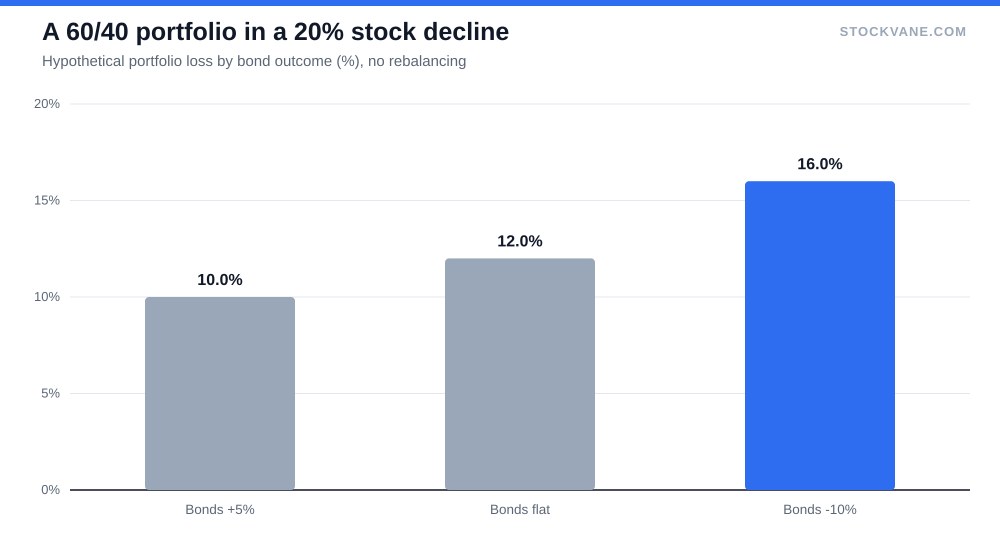
What I can do is show how much the answer matters, with an explicit hypothetical. Take a 20% stock decline and three outcomes for the bond half: a 5% gain, no change, and a 10% loss.
| Allocation (stocks/bonds) | Stocks fall 20%, bonds gain 5% | Stocks fall 20%, bonds flat | Stocks fall 20%, bonds fall 10% |
|---|---|---|---|
| 55/45 | -8.8% | -11.0% | -15.5% |
| 60/40 | -10.0% | -12.0% | -16.0% |
| 70/30 | -12.5% | -14.0% | -17.0% |
Look at the last column of the 60/40 row. When bonds fall 10% alongside stocks, the portfolio loses 16.0%. Cutting stocks to 55% only improves that to 15.5%. Raising them to 70% makes it 17.0%. A 5-point move in the split changes the stress-case loss by about half a point. The behavior of the bond half moves the loss by six points between the best and worst cases (from 10.0% to 16.0%).
That is the useful lesson of the “60/40 is dead” argument. It was never about the exact ratio. It was about the stretch when the bond half lost its cushioning, which is a scenario I have not tested against real bond data. If your bonds are the type that fall together with stocks when rates move, no split can fix that, and the fix lies in what you put in the 40, such as shorter maturities or a cash-like sleeve.
Can dividend stocks fill the 40?
The obvious shortcut is to swap part of the bond half for dividend payers. 244 of the 295 stocks pay a dividend, but the median yield among them is only 1.8%. Only 31 yield 4% or more.
Those 31 are not a safe harbor. Their median sits 11.6% below its 52-week high, and 18 of the 31 are at least 10% below it. A high yield is often what a fallen price looks like, and these are equities in every legal and practical sense. If they are held as a substitute for bonds, they will fall with the stock leg in exactly the scenario a bond sleeve is supposed to cover.
I would treat them as part of the stock allocation, with a possible tilt toward income, not as a replacement. For an equity list built around win rate instead of yield, see Top 5 Stocks to Buy for September 2026.
The counter-case
The best argument against my view is that the equity data is not alarming. SPY is 2.0% below its high. A 60/40 holder who sat through the last year has done fine, and the drift I describe is a good problem. If the rise continues, being 65% in stocks will have paid.
Even on individual stocks, being near a peak is not a warning by itself: our look at JPMorgan at a record high makes the same point about a stock that kept rising while people waited for a pullback. Buying at highs is not the error. Having no plan for the reversal is.
I accept that. Drift into a rising market is rewarded until it is not. My point is narrower: a portfolio where the owner did not choose the weights has no plan for the day the arithmetic runs the other way. And the concentration issue is concrete. When 89 of 295 stocks are already down 20% or more while the index sits near its high, the average is telling you less than it used to.
The rebalance trigger I would write down
Two things I am not covering. I am not estimating how much of a 60/40 portfolio a given investor should hold, because age, taxes and cash needs decide that, and none of them are in a market database. And I am not comparing 60/40 against alternatives such as all-equity or risk-parity funds, which would need return histories StockVane does not carry.
I would not change the 60/40 label. I would attach two rules to it. First, rebalance when the stock weight moves five points from target in either direction, using the 65.1% and 54.5% figures above as the thresholds that would have triggered a trade. Second, check what is inside the 40. If the bond holdings cannot be shown to have held up when stocks fell, replace them before adjusting the split.
The number to watch is the gap between SPY and the median stock. It is 2.0% against 12.8% now. If SPY slips to within a few points of the median stock, the market has stopped being narrow, and the stock half of a 60/40 will be worth what it says on the label. If instead the median stock falls below 20% under its high while the index holds, the index is carrying the portfolio, and I would trim it.
Financial disclaimer: The content on StockVane is for educational and informational purposes only and should not be construed as professional financial advice. Stock market investing involves risk of loss.
Sources: Dividends (SEC Investor.gov glossary) (https://www.investor.gov/introduction-investing/investing-basics/glossary/dividend) · Dividends tax topic (IRS) (https://www.irs.gov/taxtopics/tc404)