
The headline number on this page is 106. The database says 101.0. Both are right, on different days.
DoorDash closed at $203.54 on September 14, which is 106.6 times the trailing earnings of $1.91 a share. It closed at $192.94 on September 18, which is 101.0 times. Four sessions and about $11 a share took more than five turns off the multiple. That is the first thing to notice about a P/E north of 100: the denominator is so small that a normal week of trading moves the ratio by the amount a mature stock’s ratio moves in a year.
The useful way to read it is the way you would size a put you might have to own. What would I be holding, at what price, and what has to go right for that price to look ordinary in three years?
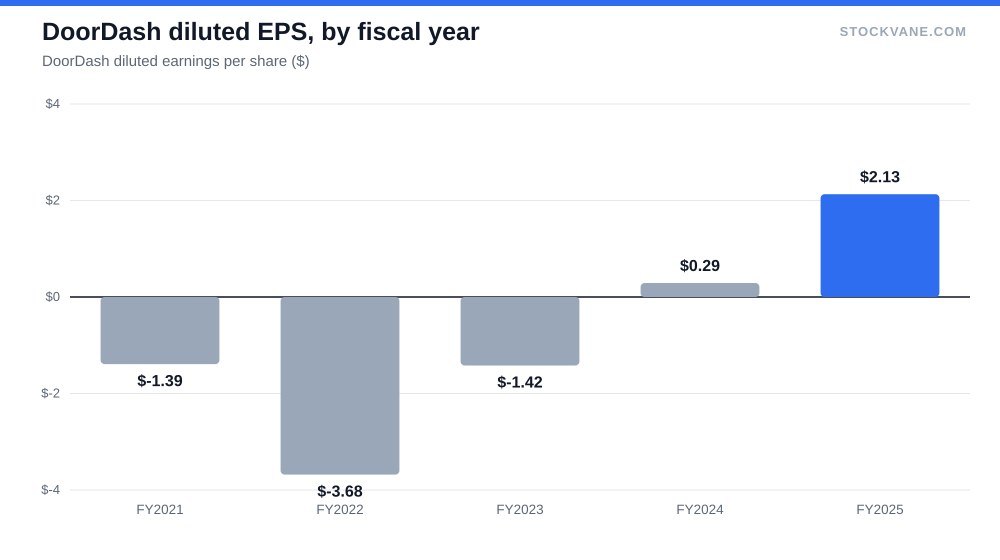
How thin the earnings base actually is
Trailing EPS of $1.91 sits against fiscal 2025 diluted EPS of $2.13, so the last four reported quarters carry less profit per share than the fiscal year they overlap. The database does not say why, and I will not guess at a cause. It does mean the 101 is not resting on rising profits in the way the fiscal-year figure suggests.
Analysts see a sharp step up. Forward EPS of $3.59 implies 88% growth from the trailing number, and prices the stock at 53.7 times. Still a high multiple, but half the trailing one, and that gap is the whole debate in one line. The valuation tab shows the same two figures side by side.
The five-year average P/E of 15.3 is unusable. The band underneath it runs from negative 179.6 to positive 210.1, because the company lost money for most of that window and reported a profit only recently. An average made of losses and one profit is arithmetic without meaning. Against the industry average of 20.6, DoorDash costs about five times as much per dollar of profit. Even Costco at 50 times earnings, a multiple that was hard enough to defend, is half of it.
The margin story is real, and recent
Operating margin, on the database’s EBIT figure, ran negative 14.8% in 2020, negative 9.2% in 2021, negative 21.2% in 2022 and negative 6.7% in 2023. In 2024 it was negative 0.4%. In 2025 it turned positive at 5.3%. The financials tab has the six-year series.
That is a turnaround, but a thin one. Five cents of operating profit per revenue dollar leaves little room to be wrong, and the profit line is the smaller of two moving parts. The larger is revenue: $13.7 billion in 2025, up 28% on $10.7 billion, following gains of 24% in 2024, 31% in 2023 and 35% in 2022. Growth has not slowed to a walk while margins recovered, which is the usual trade. The latest quarter was $4.5 billion, up 36% on a year earlier and 10% on the quarter before it, a run rate of about $17.8 billion.
Gross margin rose from 48.3% to 50.9% over the same year. Net income was $0.9 billion against $0.1 billion. I would call the profit trend earned, not accidental, and I would still not call it proven at this price.
What has to be true
I need a target multiple to do this, and I will pick one and say so. Take 30 times earnings as a fair price for a company still growing revenue in the high 20s. That is my assumption, not a database fact, and you can substitute your own.
At $192.94 a share, 30 times means earnings of $6.43 a share. Against $1.91 today, that is 3.4 times the trailing number. Two ways to get there.
The first is time. If EPS compounds at 35% a year, it takes about 4.0 years with the share price standing still. At 25%, about 5.4 years. Neither is out of the question for a company whose revenue is compounding near 30%, but both require profit to grow faster than sales for most of a decade, and that only happens when margins keep expanding.
The second is margin. The implied share count from the market value is roughly 433 million, so $6.43 of EPS is about $2.8 billion of net income. On the current $17.8 billion revenue run rate, that is a net margin of 15.6%, compared with about 6.8% now. Or, holding today’s net margin, it needs revenue near $41 billion, roughly 2.3 times the run rate.
So the price does not require a miracle. It needs revenue to keep growing near 30% and net margin to more than double, or some blend of the two. Every step in that chain has to be delivered, and the forward multiple of 53.7 already assumes the first step happens.
What the market is saying about it
The tape is not the tape of a company that has settled anything. The stock closed at $281.74 on October 6, 2025, the high for the past year. It closed at $192.94 on September 18, which is 28% below where it stood twelve months earlier. The 52-week range is $143 to $286, and the stock is 32.4% off the top.
Look at how that happened in recent weeks. It rose from $173.46 on June 18 to $236.93 on August 26, a gain of 37%, then gave back 18.6% in about three weeks. The August 5 report came three weeks before the peak. On that day the stock moved +2.9%, close to its average earnings-day move of 6.0%. The worst reaction in the last four reports came on November 5, when it fell 17.5%, and the other two, in February and May, were gains of 1.6% and 2.0%.
The database also lists a Scotiabank initiation at Buy on September 9. I would not lean on it. Analyst sentiment is warm already: of 29 covering, 79% say buy, the average target is $258, 34% above the price, the highest is $336 and the lowest is $205. The lowest target is only 6% above the price, which tells me even the cautious analysts are not modeling a large downside.
| Metric | Value | Context |
|---|---|---|
| Price (approx.) | $192.94 | 52-week range $143 to $286 |
| P/E (TTM) | 101.0x | Five-year average 15.3x |
| Price-to-sales | 5.3x | Five-year average 6.4x |
| Analyst ratings | 79% buy, 21% hold | 29 analysts; average target $258 |
The counter-case, and the score
Our Quant Rating is a D. Its numerical score fell from 54 on September 14 to 7 in the latest reading, in the same week the multiple dropped from 106 to 101. A score that moves 47 points in a week is telling me it reacts to price and valuation inputs, and I read it as a statement that this stock is expensive against its own record, not a verdict on the business.
The counter-case I take seriously is the price-to-sales figure. On revenue, DoorDash is not stretched: 5.3 times sales against a five-year average of 6.4, and 4.3 on forward sales. That sits at the 42nd percentile of its own range, and it says the market is paying for revenue at a price it has paid before. If sales growth holds at this pace and margins climb, the P/E will drop quickly without the stock moving.
Walmart’s software-style multiple, which we covered in a separate piece, rests on a far larger profit base than this one. DoorDash’s case fails if margin stalls. At a 5% operating margin, even a large revenue base produces modest profit, and the multiple never comes down through earnings. Then only the price can fix it. Short interest is 4.2% of float, with about 4.3 days to cover. That is not a crowded short, so a squeeze is not what I would count on.
What I am not covering
This is a valuation exercise, and it stops where the database stops. I did not model delivery volumes, order counts or customer numbers, because the database does not carry them. I also did not try to split the business by region or by acquisition. Those would change the growth estimate. If you want to learn how to weigh such disclosures, our guide to reading an earnings report is a starting point.
What the third-quarter report has to carry
The next report is the test, and I would grade it on two numbers. First, revenue growth staying at or above 30% against the 36% just printed. Second, an operating margin above 6%, up from 5.3%. If both hold, forward EPS of $3.59 starts to look like a floor and the stock can grow into the 101. If revenue slows into the low 20s while margin stays near 5%, then 30 times earnings needs more than a decade, and I would want a price well below $150 before paying for that. Until one of those two numbers moves, the multiple stays a bet. A stock at 101 times earnings can be a good holding, but only if you can name the quarter in which it stops being one, and for DoorDash that quarter is the one where growth drops below 25% while the margin has not moved.
Gavin Thorne has invested in U.S. stocks for six years and previously worked at a large publicly traded internet company. He writes about income-oriented strategies, including cash-secured puts, and about how he reads company data. This article reflects his personal research process and is for informational purposes only. It does not constitute investment advice.
Sources: Price-to-earnings ratio (SEC Investor.gov glossary) (https://www.investor.gov/introduction-investing/investing-basics/glossary/price-earnings-pe-ratio) · Earnings reports (SEC Investor.gov glossary) (https://www.investor.gov/introduction-investing/investing-basics/glossary/earnings-report)