
Walmart’s stock needs 5.0 turns of earnings multiple for every point of profit growth the Street expects next year. The trailing P/E is 38.7, forward earnings of $2.97 imply growth of about 8%, and revenue grew 5% in fiscal 2026. Software companies earn a multiple like that when they compound at 20% or more.
That is my whole argument. Walmart is an excellent business that has been priced as though the change in its earnings mix were finished, and the data I can see says it is not. I own no view on whether the stock falls from here; I do have a view on how much has to go right for 38.7 times to look cheap in hindsight.
What the market is paying for
Walmart closed at $107 on 2026-09-18, which is 20.8% below its 52-week high of $135 and only 9% above the low of $98. The market value is $846.8 billion, per the Walmart quote page. On trailing earnings of $2.76 a share the multiple is 38.7; on the $2.97 that analysts pencil in for the coming year it is 35.9.
Those are big numbers for a company whose revenue base is $713.2 billion. But the bull case is not silly, and I would rather state it before I argue with it. Advertising sold against a customer list this large carries almost no cost of goods. Membership fees from Walmart+ and Sam’s Club arrive whether or not the shopper buys anything that week. Delivery, once a drag on margin, gets cheaper as the store network doubles as a fulfillment layer. Every one of those lines pushes the operating margin up, and the operating margin is exactly what has been moving: the DB shows EBIT margin at 4.5% in fiscal 2026, from 3.1% in fiscal 2023.
Here I have to be careful. StockVane’s data does not break out advertising or membership income, so I cannot tell you how large those pieces are. What I can see is the result. Operating income went from $20.4 billion in fiscal 2023 to $29.8 billion in fiscal 2026, while revenue rose from $611.3 billion to $713.2 billion. Profit grew far faster than sales. That is what a mix shift toward higher-margin income looks like from the outside, and I give the bulls that point without a fight.
The multiple is not new, which cuts both ways
My first draft of this argument said Walmart used to trade at a grocer’s multiple in the low 20s. The five-year record in the database does not support that. Over that window the trailing P/E ranged from 30.1 to 43.5, and the average is 36.8. At 38.8 the stock sits at the 56th percentile of its own range. That is a hair above its own norm (1.05 times the average), not a breakout.
Two readings follow. The generous one says the market repriced Walmart before the last five years began, and it has held that price through a lot of earnings reports. The skeptical one says a five-year window that starts after the repricing tells you nothing about whether the repricing was earned. I lean toward the second, because a multiple that stays high is not evidence that the growth underneath it will show up. It only shows that buyers kept coming.
The comparison with the retail group is just as awkward for the “software” label. The industry average P/E in the same snapshot is 35.4, so Walmart’s forward multiple of 35.9 is not far from where its peers trade. The whole group is priced richly. That is a different claim from “Walmart alone has become a software stock,” and I want to be honest that the data favors the milder version. For a look at how far a big-box retailer can stretch the same idea, the Costco piece works through a multiple in the neighborhood of 50.
Growth against the multiple
The financials tab carries the six-year record I use below.
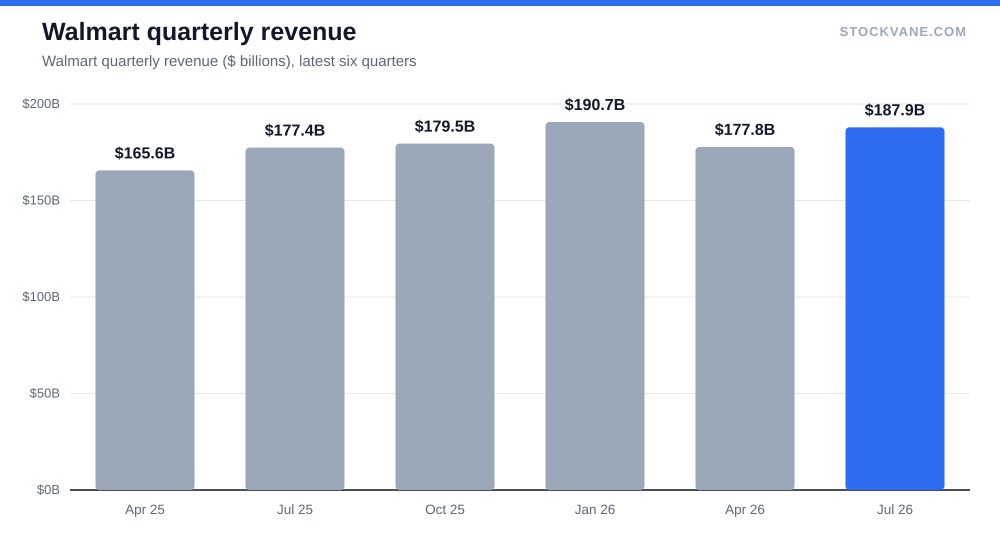
Take the last six fiscal years. Revenue went from $559.2 billion in fiscal 2021 to $713.2 billion in fiscal 2026, and each year’s growth rate fell between 2% and 7%. Fiscal 2026 came in at 5%. The latest reported quarter, $187.9 billion, was up 6% from a year earlier. Nothing there is accelerating.
Earnings per share tell a better story. Diluted EPS was $1.58 in fiscal 2021, $1.42 in fiscal 2023, and $2.73 in fiscal 2026, a rise of 73% over five years and 92% from the fiscal 2023 low. Net income climbed from $11.3 billion to $22.3 billion. Yet the growth rate has slowed each year: EPS grew 35% in fiscal 2024, 26% in fiscal 2025 and 13% in fiscal 2026. Analysts’ $2.97 for next year implies roughly 8%.
Read that sequence as a deceleration. The margin gains that carried earnings faster than sales are running into a ceiling, because a retailer with a 24.9% gross margin cannot keep taking a bigger cut without either raising prices against its own value promise or giving something back. Net margin is still only 3%. Each 10 basis points of margin is worth about $0.7 billion of profit, which matters, but it does not by itself produce software-style growth.
What the two prices say
| Metric | Value | Context |
|---|---|---|
| Price (approx.) | $106.73 | 52-week range $98 to $135 |
| P/E (TTM) | 38.7x | Five-year average 36.8x |
| Price-to-sales | 1.2x | Five-year average 0.9x |
| Analyst ratings | 90% buy, 10% hold | 31 analysts; average target $129 |
| Dividend yield | 0.90% |
There are two ways to size the expectation. The first is the PEG-style arithmetic in the opening: 5.0 turns of multiple per point of expected growth. A software company at 35 times growing 25% would score 1.4. Walmart scores three times that.
The second is the price-to-sales view. Walmart’s P/S is 1.2, against a five-year average of 0.9 and a forward figure of 1.1, which puts it at the 78th percentile of its own history. Price to book is 8.7 against a five-year average of 6.8, 73rd percentile. On sales and on assets alike the stock is expensive against its own past, which is the more useful comparison than any I could make against a software name I cannot cite from the data.
Compare that with the tone of the Street. Of 31 analysts, 90% rate the stock a buy, and the average target of $129 sits 21% above the price. Even the lowest target, $113, is 6% higher. The highest, $155, implies 45%. Nobody on that list expects the stock to fall. StockVane’s own quant grade is D, and it was D a week earlier, which reflects valuation weighing on the growth and quality inputs more than any collapse in the business. When a grade and 90% of analysts point opposite ways, one of them is going to be wrong on the timeline.
Where the revenue actually comes from
The latest segment split is a reminder of how much of Walmart is still a shop. Walmart U.S. produced $125.9 billion of the $187.9 billion quarter, about 67%. Walmart International added $35.6 billion, or 19%, and Sam’s Club U.S. $26.4 billion, or 14%. Corporate and support lines are rounding error.
Two-thirds of revenue from the domestic store base means the profit engine is still the grocery aisle. A retailer can earn a high-margin advertising stream on top of that, and probably is. But it would need to be very large relative to $29.8 billion of operating income to justify a software-like multiple on its own, and I have no data that shows it is. That is why I keep saying the market is paying for a transition that is still under way. It may complete. It has not completed.
The Microsoft piece from July makes a related point about a mature giant asking investors to underwrite a new identity, and the tension is similar even though the businesses are not. Alphabet’s case runs the other way: in the Alphabet post the argument is that the cheapest big technology stock often earns that label for a reason. Walmart is the mirror image, a store chain priced like the expensive end of technology.
The evidence that cuts against me
Here is the single most useful counterpoint: Walmart’s earnings have grown for three straight years and the gross margin has held steady near 24.9%. A business that is quietly getting more profitable per sales dollar, with the balance sheet to survive a price war, deserves a premium to an ordinary grocer. I accept that. The premium I am questioning is the size of it.
There is also a warning in how the stock reacted to its two most recent reports. After the report on May 21 the stock fell 7.3%. After 2026-08-20 it fell 9.2%, the worst reaction in the last four, against an average earnings-day move of 6.1%. In February the move was 1.4% down, and the November report produced a 6.5% gain. A stock priced for perfection reacts badly to a quarter that is merely fine, and two of the last four quarters have been that. The short interest of 1.1% of float says nobody is leaning on the other side to squeeze it, so the moves look like repricing, not positioning. I read them as a valuation adjusting to slower growth.
What I am not covering: dividend income (the yield is 0.90%, about $0.96 a share, too small to change the math), international currency effects, and any sizing of the ad business, since the database does not carry it.
What each holder should do with this
If you already own the shares from a much lower price, the fact that the multiple is high is not a reason to sell a business that has grown profit every year in this window. Taxes and the cost of finding a replacement matter more than a single ratio. If you are buying fresh, the question is the price you are willing to accept for a business growing revenue at about 5%. At $107 you are paying 38.7 times earnings for it. At the low end of the five-year band, 30.1 times, the same earnings of $2.76 imply a share price of roughly $83. That is about 22% below today, and I would call that the price at which the growth gap starts to close.
The 5% growth line I’d hold it to
Watch quarterly revenue growth. The last four quarters grew between 6% and 7% from a year earlier. If Walmart holds at 5% or better while operating margin stays above 4.5%, the earnings can keep outrunning sales and the multiple gets some support. If revenue growth slips below 4% or the margin slides back under 4%, the 8% growth the stock needs has no room to hide, and 36.8 times, the five-year average, would be the level I would start to expect. The next quarterly report is the first place that test happens.
Financial disclaimer: The content on StockVane is for educational and informational purposes only and should not be construed as professional financial advice. Stock market investing involves risk of loss.
Sources: Dividends (SEC Investor.gov glossary) (https://www.investor.gov/introduction-investing/investing-basics/glossary/dividend) · Dividends tax topic (IRS) (https://www.irs.gov/taxtopics/tc404)