
On April 24 HCA reported first-quarter results and the stock fell 8.8% the same day. Three months later, on July 24, it reported again and moved +1.5%. On January 27 it had gained 7.1%. Three earnings days, three different reactions, and a stock that now trades at $428, 22.7% below its 52-week high of $554.
I keep coming back to that pattern because it does not match the business underneath. Revenue has risen every year since 2020, operating income has risen three years running, and earnings per share reached $28.33 in 2025. The stock trades as if none of that will repeat.
My thesis is short. HCA is cheap against the broad market, at 14.3 times trailing earnings against a market median near 19, but it is not cheap against itself or its own industry, and the multiple currently assumes almost no EPS growth after a year in which EPS grew 29%. That makes it a reasonable place to be paid to wait, and a poor place to expect a re-rating without a catalyst.
What “cheaper than the market” means in numbers
The valuation tab ranks stocks with a positive P/E across the US market, 2,974 of them. On that list HCA’s P/E of 14.3 sits against a market average of 22.1 and a median of 19.0. On price to sales the gap is wider: 1.2 times sales against a market median of 2.2. One clarification on scope. That comparison set is every US-listed stock the data covers, S&P 500 members included, so read “market” as the broad US market.
Both measures say the same thing. The market pays about 19 times earnings for the middle stock, and HCA costs about three-quarters of that. A dollar of HCA’s revenue is priced at about half what the median dollar of revenue is priced at.
Now the qualifier. The database’s peer group is Medical Care Facilities, 30 stocks, with an average P/E of 14.3. HCA is at 14.4. Against its five-year average of 14.5, and a five-year band of 11.8 to 17.1, it sits at the 52nd percentile of its own history. So the discount belongs to hospital operators as a group, and HCA is the largest name in it. If someone tells you this stock is undervalued because it trades below the market, the right reply is that the whole hospital group sits at the same multiple, so the discount belongs to the industry.
The earnings record the multiple ignores
Revenue on the financials tab ran $51.5 billion in 2020, $58.8 billion in 2021, $60.2 billion in 2022, $65.0 billion in 2023, $70.6 billion in 2024 and $75.6 billion in 2025. Growth was 14%, 3%, 8%, 9% and 7% in the last five of those years. The trend line is steady at a mid-single to high-single-digit rate. Nobody will call it exciting.
Operating income, computed as operating profit over revenue, gives margins of 14.1%, 16.5%, 15.0%, 14.8%, 14.9% and 15.8% across 2020 to 2025. The database’s separate EBIT margin series reads differently, 13.6% to 19.4% with a 2021 spike and a 2023 dip to 14.8%. I am using the operating-income version because it moves less and matches the dollar figures: $7.3 billion in 2020 rising to $12.0 billion in 2025.
The interesting line is the gross margin, which went from 37.4% in 2020 to 38.5% in 2022, 39.4% in 2023, 40.6% in 2024 and 41.5% in 2025. Five years added 4.1 points, and 2025 alone added 0.9. In a business that people describe as reimbursement-constrained, the direction is right.
Where the 29% came from
Net income rose from $6.66 billion in 2024 to $7.8 billion in 2025, up 17%. Diluted EPS rose from $22.00 to $28.33, up 29%. Twelve points of daylight between those two growth rates has a cause, and the likely source is a lower share count. Dividing net income by EPS gives roughly 303 million shares for 2024 and 275 million for 2025, a reduction of about 9%. I am deriving that from two reported figures with no buyback disclosure in hand, so treat it as an estimate.
Two things follow. First, EPS growth of 29% is not a repeatable rate if over a third of it is share count. Second, buybacks help explain the negative book value in the data: price to book is -14.0, against a five-year average of -38.2. A negative book multiple alone warns of nothing; heavy repurchases do to a company’s equity account, and the reason P/B is useless for HCA and P/E is the honest measure.
Look at the 2022 and 2023 records too. Net income fell 11% in 2022 and 11% again in 2023, from $7.72 billion to $6.09 billion in two years. A bad stretch looks like that for HCA, and it is worth having in mind when someone says the business is a straight line. It is a steady grower with an occasional two-year pause.
| Metric | Value | Context |
|---|---|---|
| Price (approx.) | $427.71 | 52-week range $353 to $554 |
| P/E (TTM) | 14.3x | Five-year average 14.5x |
| Price-to-sales | 1.2x | Five-year average 1.2x |
| Analyst ratings | 62% buy, 33% hold | 21 analysts; average target $454 |
| Dividend yield | 0.70% |
What the market is pricing
The forward P/E is 14.1 on $30.25 of expected EPS, against trailing EPS of $29.82. Analysts therefore expect about 1% EPS growth over the next twelve months. After 29%, that is a sharp deceleration to almost zero, and the stock is priced accordingly. Forward and trailing multiples are only 0.3 turns apart.
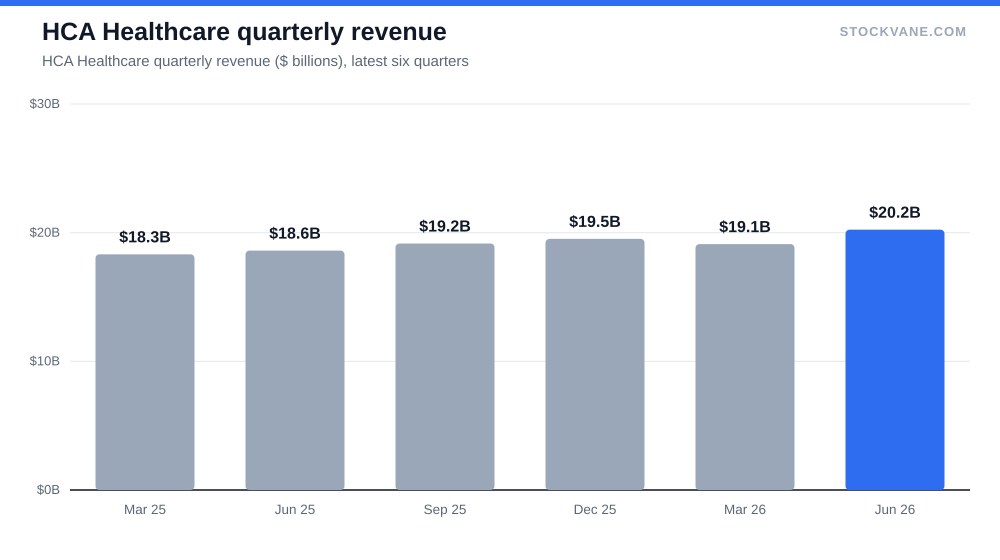
Two ways to read that. The optimistic one: the bar is low, and any print that shows EPS of $32 or better would put the forward multiple below 13.5 and pull the price toward the analyst average of $454, 6% above today. The cautious one: the estimates are low because the analysts see something. The last two quarterly revenue prints were $19.1 billion (+4%) in the first quarter of 2026 and $20.2 billion (+9%) in the second. The first of those is the slowest in the series I hold, and it is the one the stock fell 8.8% on.
On the analyst side, 21 cover the stock, 62% rate it a buy, and targets run from $380 (11% below the price) to $579 (35% above). A spread that wide between the bull and bear cases, with the low target under the market, says the professionals are not in agreement about the margin trend.
How the counter-case reads
The strongest argument against buying at 14 times is the one I cannot dismiss: reimbursement risk is a real cost that other sectors do not carry. A change in Medicaid or exchange coverage rules would reach hospital revenue directly, and I read the industry-wide discount as the price of that exposure. UnitedHealth’s margin story on this site is a live example of how fast a healthcare margin can turn once cost trends move against the payer side. HCA is not in that position on the numbers I hold. The same industry produced that problem, though.
There is also the momentum evidence. The quantitative score moved from C to D in the last several weeks, and short interest is 2.8% of float at about five days to cover. Neither is alarming. Both say that nobody is rushing in.
What I am not covering: the mix of Medicare, Medicaid and commercial payers is not in my dataset, so I cannot test the payer-mix fear directly. All I can say is that consolidated margins did not collapse in any of the six years I have.
Income angle
For an income-minded holder this is a modest payer. The trailing dividend is $3.00, a yield of 0.70%. The yield is too small to be a reason to own it. If I were selling puts against it, the pitch is the entry price, with the coupon a side note: being assigned at a level that equals 12 times trailing earnings, about $358, would land near the 52-week low of $353, which is where the data says buyers have shown up before. I have no option chain in the database, so treat the strike as a framework and nothing firmer.
Compare that framework with Costco at 50 times earnings or with Walmart’s software-style multiple: those two ask you to pay for growth that has not arrived. HCA asks nothing of the sort. It asks whether a company that just earned $28.33 per share can defend $30.
The EPS figure that makes 14 times honest
The number to watch in the next report is full-year EPS against the $30.25 consensus. If the company delivers $32 or more, then last year’s 29% was a step up to a new base and 14 times is cheap for it. If it lands at $30 or under, the market was right to price a plateau, and the discount to the broad market is just the cost of hospital exposure.
My line is $31. Above it, I would say the multiple is too low. Below it, I would leave the stock where it is.
Gavin Thorne has invested in U.S. stocks for six years and previously worked at a large publicly traded internet company. He writes about income-oriented strategies, including cash-secured puts, and about how he reads company data. This article reflects his personal research process and is for informational purposes only. It does not constitute investment advice.
Sources: Dividends (SEC Investor.gov glossary) (https://www.investor.gov/introduction-investing/investing-basics/glossary/dividend) · Dividends tax topic (IRS) (https://www.irs.gov/taxtopics/tc404)