
In July the argument about Microsoft was about identity. Was it a software company, an AI utility, or an expensive experiment? On July 10 the shares closed at $384.38, about 30% below their 52-week high, and both sides had a story ready. By the end of the month the market had stopped arguing and paid $60 more.
I want to go back over that stretch, because the setup was more useful than the resolution. A stock can be right for the wrong reasons, and a 15.5% jump in a single day is a poor substitute for knowing what you were buying.
What the July numbers actually said
Microsoft’s fiscal year ended in June, and the financials tab shows what it produced. Revenue for fiscal 2026 was $331.8 billion, up 18%. Net income was about $134 billion, up 31%, and diluted earnings per share were $17.95, up 32%. Operating margin rose from 45.6% to 46.8%. That is a company growing faster than it did a year earlier and keeping more of each dollar, which does not fit the word crisis.
The fiscal fourth quarter was consistent with that. Revenue was $90.0 billion, up 18%, and quarterly net income was $35.8 billion, up 31%. Three segments carry the business: Productivity and Business Processes at $140 billion for the year, Intelligent Cloud at $138 billion and More Personal Computing at $54 billion. Geography is balanced too: 51% of revenue came from the United States and 49% from the rest of the world. No single line carries the company, and that is why I never gave much weight to the argument that the stock was broken.
Costs tell the same story from another angle. Gross margin slipped from 68.8% to 67.9%, which is what you would expect when the company is running expensive new infrastructure, yet operating margin still rose by more than a point. Research and development was $35.6 billion, up 9.5%, so it grew at roughly half the pace of revenue. Whatever else is happening, the company is not letting its operating expenses run away while it builds.
The number that made people nervous
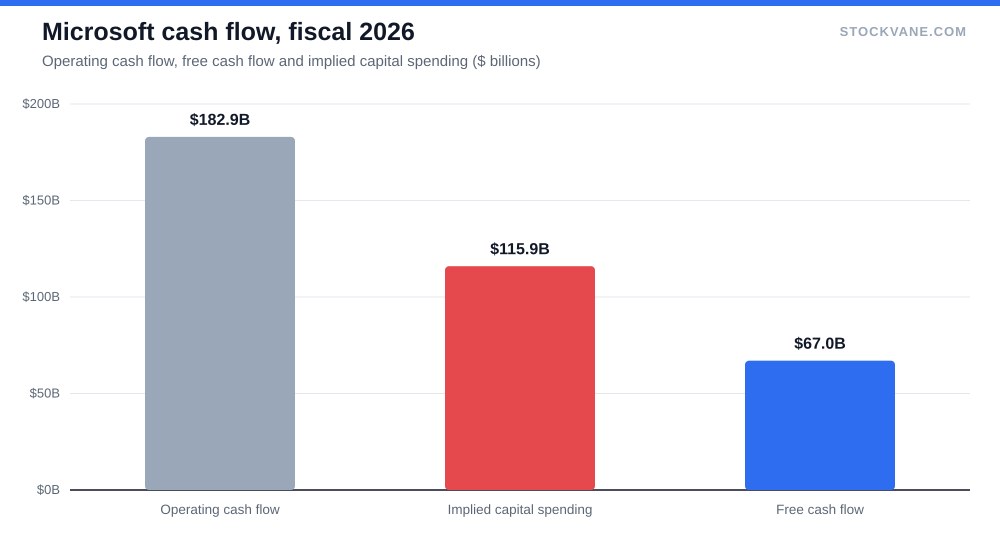
The actual worry was cash. Operating cash flow for the year was $182.9 billion, up 34%, but free cash flow was $67.0 billion, down 6%. The gap between them is capital spending, and by our arithmetic it was about $115.9 billion, against $64.6 billion the year before. That is an increase of 80% in twelve months.
| Fiscal year, $ billions | 2025 | 2026 | Change |
|---|---|---|---|
| Revenue | 281.7 | 331.8 | +18% |
| Operating profit | 128.5 | 155.2 | +21% |
| Net income | 101.8 | 133.7 | +31% |
| Operating cash flow | 136.2 | 182.9 | +34% |
| Free cash flow | 71.6 | 67.0 | -6% |
| Implied capital spending | 64.6 | 115.9 | +80% |
The most recent quarter shows the same pattern in miniature. Operating cash flow was $55.4 billion, up 30%, while free cash flow was $19.6 billion, down 23%, which puts the quarter’s capital spending near $35.8 billion. Spending is still growing faster than the cash the business throws off, and that is the fact the July worry rested on.
That is the identity question in one line. If the spending earns returns, the stock deserved the recovery. If it does not, the company is converting a great business into a construction project. I do not know which of those is closer to the truth, and I do not think anyone outside the company does either. Our AI capex piece looked at how the industry’s spending compares with earlier cycles, and its main point holds for Microsoft as much as for anyone: the money is being spent either way, so the real question is when it starts to show up in profit.
The day the argument ended
Microsoft reported on July 29. The shares closed that day at $389.81. The next day they closed at $450.25, a gain of 15.5%, and by the end of August they were near $507.
It was a big change of mind for a stock that had fallen on three of its previous four reports. The moves on those days were -2.9%, -10.0% and -3.9%, and then +15.5%. The average absolute move over those four reports was about 8%. I would not draw a rule from that. What it shows is that this stock had been reacting badly to reports that beat expectations, and that the market can reverse a mood in one session when it stops fearing the spending.
I have no evidence from our data of why the buyers came, and I would be wary of anyone who claims to. The July 29 report is the obvious candidate, and the timing supports it, but timing is not proof.
Where the stock sits now
Microsoft closed near $493.78 on September 18, about 28% above its July 10 price and about 10% below the 52-week high of $549. The valuation tab shows a trailing P/E of 27.5, against a five-year average of 32.5, and a forward P/E of 25.1. At the July 10 price the same fiscal 2026 earnings carried a multiple of about 21. Today the multiple is a little below its own history, which is roughly where a well-run, steadily growing company tends to trade.
| Metric | Value | Context |
|---|---|---|
| Price (approx.) | $493.78 | 52-week range $349 to $549 |
| P/E (TTM) | 27.5x | Five-year average 32.5x |
| Price-to-sales | 11.1x | Five-year average 11.7x |
| Analyst ratings | 97% buy, 3% hold | 32 analysts; average target $573 |
| Dividend yield | 0.72% |
Of the 32 analysts on the analyst consensus page, 97% rate it a buy and none rate it a sell. The average target of $573 is about 16% above the price, and the lowest, $510, is 3% above it. A floor that close to the price says the analysts who are most cautious still expect modest gains.
The quant model is less generous. It graded Microsoft a B with a score of 71 on September 8 and a D with a score of 27 on the latest date. I do not have its weights, so I cannot tell you which inputs did that, but the timing, after a 28% rally, suggests it is reading price behavior, with the business a secondary input. I would not sell a company that earned $134 billion because a score on a page slipped.
Against the other giants
It helps to line Microsoft up against the companies it is usually compared with.
| Company | Trailing P/E | Forward P/E | From 52-week high |
|---|---|---|---|
| Microsoft (MSFT) | 27.5x | 25.1x | -10% |
| Alphabet (GOOGL) | 17.5x | 25.6x | -14% |
| Amazon (AMZN) | 20.4x | 26.9x | -12% |
| Meta (META) | 25.1x | 21.0x | -15% |
| Apple (AAPL) | 38.5x | 36.1x | -2% |
| Oracle (ORCL) | 23.1x | 20.6x | -55% |
Apple is the outlier at the expensive end and Alphabet sits at the cheap end, with Microsoft in between on both trailing and forward P/E. Oracle is worth a look because it is 55% below its high and has not recovered the way Microsoft has, so a large fall in an AI-linked company was not unique to Microsoft’s July. Our Microsoft forecast covers what happens if the spending outruns the revenue. The point I take from the table is that Microsoft is not the cheap one and it is not the stretched one. It is priced like a leader.
Who is betting against it
Very few. The August 31 short interest report showed about 1.0% of the float sold short, with about 3.2 days needed to cover. That is a low reading for a stock that fell 30% and then rose 28% in a few months, and it means the July skeptics mostly expressed themselves by not buying.
Headlines I would not skip
Two items in the news feed deserve attention. On September 3 an officer’s sale of about $43 million of stock was reported, and on September 15 a filing proposed a further sale of about $28 million. Insiders sell for many reasons, tax bills and diversification among them, and I would not read a motive into either one. But a stock that has risen quickly and now has insiders selling is also a stock where the easy money has already been made.
On September 3 the company also introduced a new reporting structure that separates AI and cloud results. If it gives investors a cleaner look at whether the spending is earning a return, it is the most useful thing that could happen to the argument. I have not seen the new numbers, so I will hold off on judging what they show.
What I would still not pay for
The rally changed the price, not the arithmetic. Microsoft still spends more on buildings and machines than it did a year ago, still keeps a smaller share of its operating cash than it did, and still depends on the bet that customers will pay for what all that capacity produces. Those three facts were true at $384 and are true at $494.
I would not pay for the idea that the July fear was foolish. The cash flow numbers were real, and they have not gone away. A company can spend $116 billion in a year and be right, but it cannot spend $116 billion and be exempt from the question of what it bought.
My view is that Microsoft at about 25 times forward earnings is a fair price for a business that is growing profit by 30% and has three large segments. It is not a bargain, and it is no longer a crisis. If you missed the July low, I would not chase the last 28%. I would wait for a report where free cash flow turns up while spending is still rising, because that is the quarter that would settle the argument for good. The last report a year ago landed on October 29, so I would expect the next one around then, and I would read the cash flow statement before I read the headline.
Financial disclaimer: The content on StockVane is for educational and informational purposes only and should not be construed as professional financial advice. Stock market investing involves risk of loss.
Sources: Dividends (SEC Investor.gov glossary) (https://www.investor.gov/introduction-investing/investing-basics/glossary/dividend) · Dividends tax topic (IRS) (https://www.irs.gov/taxtopics/tc404)