
“Is this a bubble?” fits in a headline, which is why everyone asks it, but it is a poor question to size a position with. A better one is which line in the numbers breaks first if the spending outruns the payoff. There are three candidates, and the financial statements of the companies involved let us look at each one.
The short version of my view is that the buildout and the excess are both real, at the same time, and that they are not equally distributed. The hyperscalers spending the money have cash flow behind them. The financing loops around the chip suppliers are where I would look for trouble first.
The scale of the spending
Amazon, Alphabet, Microsoft and Meta are guiding to somewhere between $720 billion and $745 billion of capital spending in 2026 after the second-quarter reports, which is up roughly 77% from last year’s record of about $410 billion. By company, that is roughly $220 billion at Amazon, $195 billion to $205 billion at Alphabet, about $190 billion at Microsoft and $130 billion to $145 billion at Meta. All four raised their plans this summer, and analysts already have a number above $1 trillion pencilled in for 2027.
Our data tells the story from the other side, in reported results. Take each company’s latest fiscal year, which is calendar 2025 for Amazon, Alphabet and Meta and the year to June 2026 for Microsoft. Together they spent about $405 billion on property and equipment. Two fiscal years earlier the same four spent about $152 billion, so the total is up about 2.7 times in two years.
What the cash flow statements say
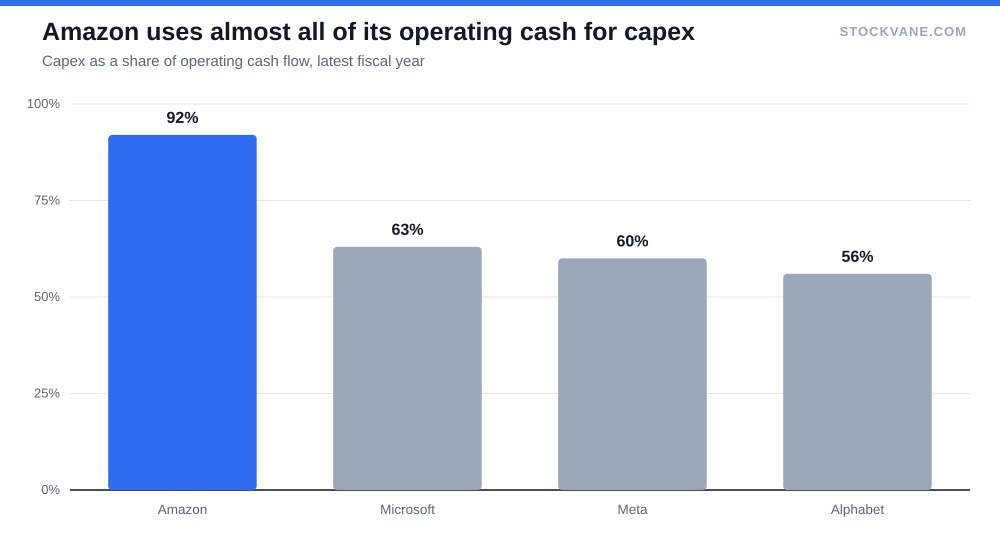
Capital spending is only frightening relative to the cash that pays for it. Here the picture splits. In its latest fiscal year, Alphabet spent about 56% of its operating cash flow on capex, Meta 60%, Microsoft 63% and Amazon 92%. Across all four, spending has gone from about 40% of operating cash flow two years earlier to about 67% now.
| Company | Capex | Operating cash flow | Capex as share of operating cash flow | Free cash flow |
|---|---|---|---|---|
| Amazon | $128.3 billion | $139.5 billion | 92% | $7.7 billion |
| Microsoft | $115.9 billion | $182.9 billion | 63% | $67.0 billion |
| Meta | $69.7 billion | $115.8 billion | 60% | $46.1 billion |
| Alphabet | $91.4 billion | $164.7 billion | 56% | $73.3 billion |
Amazon is the tightest. Its financials tab shows operating cash flow of $139.5 billion and capex of $128.3 billion, which left free cash flow of only $7.7 billion, down from $32.9 billion a year earlier. Alphabet is the most comfortable. Its financials show $164.7 billion of operating cash flow against $91.5 billion of capex, and free cash flow of $73.3 billion, about level with the year before. Microsoft’s free cash flow fell to about $67 billion in the year to June from $71.6 billion, even though operating cash flow rose by a third.
None of that is a warning by itself. Companies with these cash flows can fund a build cycle for a few years. The number to watch is how far the ratio can rise before the dividend, the buyback or the balance sheet starts to give.
The bull case, stated fairly
Before the fear, the case for the spending deserves a hearing, because a lot of bubble commentary skips it. Revenue is climbing alongside capex, which is what you would want from a real buildout and not a speculative mania. Nvidia’s revenue for its fiscal year to January 2026 was $215.9 billion, up about 65%, and its latest quarter was $96.2 billion, more than double the same quarter a year earlier. Amazon’s revenue reached $716.9 billion in 2025 and Alphabet’s $402.8 billion. The demand is in the reported results.
There is a mismatch worth keeping in view, though. The four companies’ own revenue grew between 12% and 22% in their latest fiscal year, roughly 12% at Amazon, 15% at Alphabet, 18% at Microsoft and 22% at Meta. That is healthy for businesses of this size. It is also far slower than the 2.7-fold rise in capital spending over two years, and the gap between those two numbers is the thing the market has to keep being comfortable with.
Large capital cycles are also not new. Railroads, telecom networks and the electrical grid were all built this way, and the companies that came out the other side had durable advantages. Those buildouts produced something real. The open question is whether the price paid in advance leaves anyone a return, and for the railroads and the telecom carriers the answer was often no.
The bear case is about the loop
The bear case is about circular financing, and the mechanism is simple once you strip off the jargon. A chip maker or cloud company invests billions in an AI startup. The startup uses that money to buy chips or cloud capacity from the investor. The investor books the sale as revenue. No new outside cash has entered the loop.
The clearest example is Nvidia and OpenAI. In September 2025 they announced a letter of intent under which Nvidia could invest as much as $100 billion to support at least 10 gigawatts of Nvidia systems. The deal never became a contract. What Nvidia finalized instead was a stake of about $30 billion in OpenAI’s funding round in early 2026, and Jensen Huang said a $100 billion outcome was “probably not in the cards.” The smaller check is a sign that the original plan was more ambitious than the reality, and it is also a reminder of how tightly one supplier’s fortunes are tied to one customer’s ability to raise money.
I would not call that fraud, or even unusual for a boom. Vendor financing shows up in every buildout, and the late-1990s telecom equipment makers are the example everyone reaches for, when suppliers funded customers’ purchases, booked the sales as growth, and then had a problem when demand did not arrive on schedule. What matters is whether the financing is a small part of a real business or a large part of an unproven one.
The receivables clue
There is one place in our data where this shows up directly. Nvidia’s receivables, the money customers owe it for products already shipped, jumped to about $63.1 billion at the end of July from $40.7 billion three months earlier, an increase of about 55%. Revenue over the same stretch rose about 18%.
| Quarter ended | Nvidia revenue | Receivables | Days of sales outstanding |
|---|---|---|---|
| Jul 2025 | $46.7 billion | $27.8 billion | 54 |
| Oct 2025 | $57.0 billion | $33.4 billion | 53 |
| Jan 2026 | $68.1 billion | $38.5 billion | 51 |
| Apr 2026 | $81.6 billion | $40.7 billion | 45 |
| Jul 2026 | $96.2 billion | $63.1 billion | 60 |
Put another way, customers were taking about 60 days of sales to pay in the latest quarter, up from about 45 days in the prior one and roughly 54 a year earlier. I am not going to assign a cause, and nothing in these numbers says a customer is in trouble. Receivables can rise for ordinary reasons, including the timing of large shipments late in a quarter. But it is the kind of line I would watch in Nvidia’s financials over the next few reports, because financing that shows up as receivables does not announce itself. It sits on a balance sheet until it does.
What would ease the worry is straightforward: receivables that fall back toward the old level of days, or a quarter in which revenue grows faster than what customers owe. What would deepen it is a second quarter of the same pattern. One quarter is a data point, and two starts to look like a trend.
Depreciation is the quiet cost
The part that gets the least coverage is depreciation. Put $100 billion into servers and buildings that last five to six years and the straight-line arithmetic is $17 billion to $20 billion a year of depreciation before that batch of spending has earned anything back. That is accounting, not a forecast.
It is already in the reported numbers. Microsoft’s depreciation and amortization was about $38.5 billion in the year to June, roughly 84% above two fiscal years earlier. Alphabet’s is up about 77% over the same span. The market has tolerated this because cloud revenue keeps growing and because every chief executive believes that underinvesting and losing the infrastructure race is worse. Tolerance can end quickly, though. If cloud growth slows while capex stays at this pace, multiples for the whole group can compress at once, because markets do not reprice hundred-billion-dollar assumptions one company at a time. Our look at Microsoft’s bill coming due and at Meta’s spending shock covers how that has played out for two of the four so far.
Where I would look for the first crack
I cannot say which side will turn out right. Two numbers would move me. The first is capex as a share of operating cash flow at each hyperscaler, which shows how much room is left before the dividend or the buyback has to give. Amazon, at 92%, has the least. The second is days of sales at Nvidia, which is where a financing loop would show up first.
My call is that the four hyperscalers can carry this for another two years on their own cash flow, and that the weak link is further out, at the suppliers whose customers depend on outside money. If Nvidia’s days of sales are above 60 again next quarter while cloud growth is flat, I would treat it as the first crack and trim exposure to the group. That is a judgment about timing as much as about value, and the timing is where I am most likely to be wrong.
Financial disclaimer: The content on StockVane is for educational and informational purposes only and should not be construed as professional financial advice. Stock market investing involves risk of loss.