
Moody’s net income was $2.21 billion in 2021. It fell to $1.37 billion in 2022, and it took until 2025, at $2.46 billion, for the company to clear the old mark by a real margin. Three years of walking in place, at a business people call a moat.
That gap is the honest place to start, because a moat is not the same as immunity. My view: Moody’s is a hard business to attack, and the record shows it, but the stock at $469 is priced for the moat and only partly for the cycle that sits on top of it. The evidence is the 2022 dent, the speed of the repair, and a valuation that has come down to 29.7 times trailing earnings from a five-year average of 38.5.
What the moat is, and what it is not
Most large corporate bonds sold in the United States carry a rating from Moody’s or S&P Global, and bank and insurer capital rules lean on those ratings. Buyers of the debt expect them. That expectation is the moat. A new agency cannot simply publish grades and be believed; it has to earn decades of default statistics first, and issuers will not pay two fees to a newcomer nobody’s investment committee recognizes.
I read that as a structural fact rather than something in the financials, so our data cannot confirm it directly. What our data can do is show the consequences: gross margin of 74.4% in fiscal 2025, up from 72.6% the year before. Very few companies keep three quarters of every revenue dollar after direct costs and then improve on it while growing.
The same facts also mark the edges of the claim. Ratings revenue is paid mostly when debt is issued. So the franchise is protected against competitors, not against the calendar. When borrowing freezes, the toll booth stays where it is and the cars stop coming.
The 2022 test
The cleanest experiment ran in 2022, and the financials tab shows it plainly. Revenue fell 12%, from $6.22 billion to $5.47 billion. Operating income fell much further, from $2.84 billion to $2.00 billion, a drop of about 30%. The EBIT margin our data reports slid from 47.5% to 36.7%, a loss of almost eleven points in one year.
Costs did not fall with revenue. Analysts, compliance staff and technology are fixed in the short run, so a 12% revenue drop became a 30% profit drop. Net income fell 38% and diluted EPS 37%, from $11.78 to $7.44.
Then the repair. Revenue rose 8% in 2023 to $5.92 billion, 20% in 2024 to $7.09 billion, and 9% in 2025 to $7.7 billion. EBIT margin went 38.2%, 42.9%, 44.2%. It is still short of the 47.5% peak, and that shortfall is the first thing I would tell someone to keep in view: after four years, the company has recovered about seven of the eleven points it lost.
Read against the title, this is a mixed answer. Nobody crossed the moat in 2022. The business held a 36.7% margin in its worst recent year, which most companies never see in their best. But it also showed that “almost nobody can cross” describes competition, not the credit cycle.
Two engines, and which one carries the stock
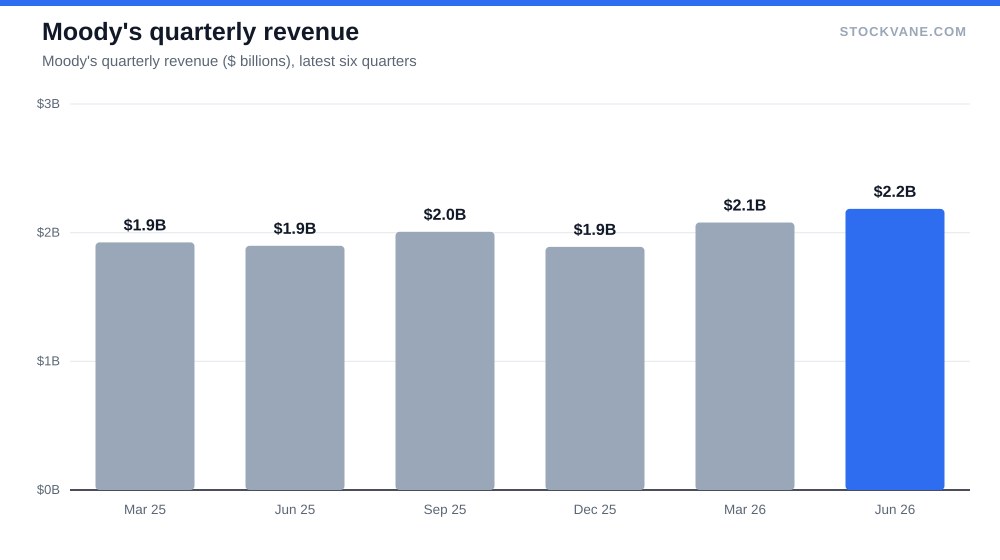
The June quarter split revenue into two segments. Moody’s Investors Service, the ratings arm, booked $1.31 billion, about 60% of the segment total. Moody’s Analytics, the subscription and data side, booked $0.93 billion, about 42%, before an eliminations line of about $55 million pulls the sum back to $2.2 billion of consolidated revenue.
That mix matters more than the headline. Ratings revenue swings with issuance. Analytics is sold as a subscription, and I would expect it to hold better in a freeze, though our data does not split the 2022 decline by segment, so treat that as inference and not measurement. What the numbers do show is that the latest quarter grew 15% year over year and 5% from the prior quarter, in a year when total 2025 revenue growth was 9%. Quarterly run-rate revenue is now about $8.7 billion.
Here is the arithmetic I keep coming back to. If revenue grows 9% and the margin sits at 44%, operating profit rises around 9%. If the margin recovers to the old 47.5%, profit rises nearer 17%. So the recovering margin is worth as much to earnings as a full year of revenue growth. That is the part of the story the “moat” label hides.
What the price already assumes
At $468.59, the market value is $81.2 billion. Trailing P/E is 29.7. Forward P/E on the $16.56 consensus EPS is 28.3, which implies about 5% growth from the trailing $15.76. A 5% growth forecast for a company that grew EPS 21% in 2025 and 29% in 2024 is either sandbagging or a sign that the analysts have already banked the rebound.
Against its own history, the stock is cheap-ish, as the valuation tab shows. Trailing P/E of 29.7 is 0.77 times its five-year average of 38.5, and sits at the 12th percentile of that range (the band ran 32.1 to 44.9). Price to sales tells the same story: 9.9 against a five-year average of 11.1.
Price to book says the opposite. It sits at 26.8 against 22.9, near the 89th percentile of its own history. Book value is a poor yardstick for a ratings business, and buybacks shrink equity, so I would not lean on it either way. But both readings are in the record and I would rather show both than choose the flattering one.
The stock is 13.7% below its 52-week high of $543 and 17% above the low of $400. It is in the lower half of the year’s range, with the earnings multiple in the lower part of its five-year band. For a business whose margin has not yet fully recovered, that is not an alarming place to be.
| Metric | Value | Context |
|---|---|---|
| Price (approx.) | $468.59 | 52-week range $400 to $543 |
| P/E (TTM) | 29.7x | Five-year average 38.5x |
| Price-to-sales | 9.9x | Five-year average 11.1x |
| Analyst ratings | 78% buy, 22% hold | 18 analysts; average target $568 |
| Dividend yield | 0.84% |
What Wall Street and the tape are saying
Of 18 analysts covering the name, 78% rate it a buy and none rate it a sell. The average target is $568, 21% above the price; the range is $505 to $610, so even the lowest target sits 8% above the current quote. When every analyst’s floor is above the price, I discount the consensus a little. It is not that they are wrong. It is that a group with no bears has not stress-tested its own number.
The quant grade in our data moved from C to D in the past week. I would not trade on that, but it is a reminder that the price and the score are measuring different things; the grade is picking up the near-term price and estimate trend rather than franchise quality.
Reaction to results has been quiet. The stock moved -0.2% on the 2026-07-22 report, against an average earnings-day move of 2.7%. Short interest is 1.5% of float. Nobody is betting hard against the shares, and nobody is chasing them either. The dividend adds 0.84% a year, or $3.94 per share, which is not the reason to own it.
The counter-case
The bear argument has two parts, and only one of them is about the moat.
The first is the cycle. Fiscal 2022 was a rate shock that shut the bond market for months. If it recurs, the same fixed-cost squeeze that pushed margin from 47.5% to 36.7% comes back. At today’s revenue of about $7.7 billion, a 12% drop would take out roughly $0.9 billion of sales, and if costs behaved as they did last time, operating income would give up a bit under a third of its $3.46 billion. That is around $1 billion of profit, from a company whose full-year net income is $2.46 billion.
The second is the price of admission. At 29.7 times trailing earnings, even after the drop from history, the shares do not carry a large margin of safety against a repeat. I said above the multiple is low against its own past. It is not low against the market’s long-run average, and it certainly is not low against a bond-market year like 2022, when the multiple would matter far less than the earnings underneath it.
I am not covering regulatory risk, artificial-intelligence competition in analytics, or litigation. They may matter. None of them shows up in our data, and I would rather leave them out than guess.
How this sits with other franchise stories
Comparisons help. In our note on Visa as a toll road, the question was who builds the bypass. For Moody’s that question has a different answer: a bypass requires decades of default history and regulator acceptance, so the threat is slower and less visible than in payments. But Visa’s revenue follows spending, which rises almost every year. Moody’s follows issuance, which does not.
The other useful link is macro. Our piece on the September 16 Fed hike covered why the path of rates changes what companies borrow. Lower rates are the usual tailwind for issuance, and higher ones a headwind, which matters because issuance drives ratings revenue. That is the most direct outside variable for this stock, and it is one I can watch weekly without opening a filing.
Where 44% has to hold
The number to watch is the EBIT margin, currently 44.2% for fiscal 2025. If the company reports 2026 at or above 45%, the recovery is on track, the forward multiple of 28.3 looks fair, and I would call the stock reasonable for a franchise. If the margin drifts under 43% while revenue is still growing, costs are outrunning the moat, and the argument I began with, that three years passed before net income beat 2021, will start to look like the pattern instead of the exception.
Revenue is the second line. Growth below about 5% for two consecutive quarters would say issuance has stalled again, and I would not want to hold it at nearly 30 times earnings on that evidence.
Financial disclaimer: The content on StockVane is for educational and informational purposes only and should not be construed as professional financial advice. Stock market investing involves risk of loss.
Sources: Dividends (SEC Investor.gov glossary) (https://www.investor.gov/introduction-investing/investing-basics/glossary/dividend) · Dividends tax topic (IRS) (https://www.irs.gov/taxtopics/tc404)