I sold too early once before. 2021. Called the market frothy at 35x CAPE, moved a chunk to cash, felt very smart for about six weeks before the index climbed another 18% without me. That experience left a specific scar — the kind that makes you second-guess every bearish instinct afterward, which is probably exactly what the market wants.
So when I tell you the CAPE ratio is sitting at 41.6 right now and I genuinely don’t know what to do about it, that’s not a rhetorical device. I actually don’t know. And anyone who tells you they do is either very smart or not thinking hard enough about the question.
Let’s start with the number itself, because people throw it around without explaining what it actually measures.
Robert Shiller at Yale built the CAPE — Cyclically Adjusted Price-to-Earnings — to solve a specific problem with the regular P/E ratio. Normal P/E divides today’s stock price by one year of earnings. The problem is that one year of earnings is noisy. If a recession hits and earnings collapse temporarily, the P/E ratio spikes upward and makes stocks look expensive precisely when they’re cheapest. CAPE smooths this out by using ten years of inflation-adjusted earnings instead of one. The result is a cleaner picture of what you’re paying for the long-term earning power of the market.
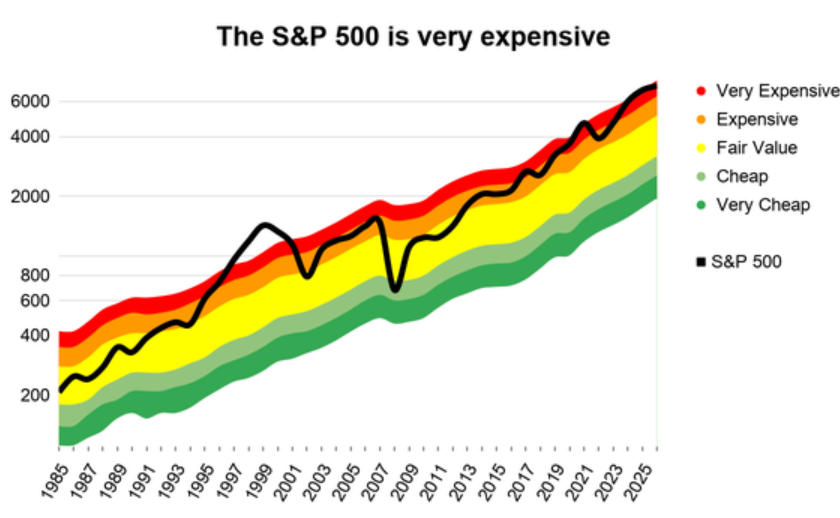
The long-run average for CAPE since 1881 is 17.3. Today it’s 41.6. That’s not slightly elevated. That’s more than double the historical mean. In the entire dataset going back 140-plus years, the only higher reading was December 1999 at 44.19 — two months before the dot-com peak.
I find it interesting that most financial writing at this moment in 2026 either treats that fact as terrifying or explains it away entirely. Both reactions miss something.
The terrifying camp has a legitimate argument. When CAPE has been near 40, forward ten-year returns have historically been poor. Invesco’s research on this is pretty direct: at CAPE readings around 40, the S&P 500’s annualized returns over the subsequent decade turn negative in real terms. Not every time — there’s scatter around that finding — but often enough that the relationship holds statistically. Shiller himself spent years demonstrating this inverse correlation between starting CAPE and 20-year forward returns using 130 years of data. The man won a Nobel Prize partly for this work. His methodology isn’t fringe.
The Buffett Indicator — total US market cap divided by GDP — is north of 200%. It’s only briefly been that high before, always at market peaks. Forward P/E on the S&P 500 is 21.1 against a 10-year average of 18.9. The equity risk premium — the extra return you get for owning stocks over Treasury bonds — has compressed to something near zero depending on how you calculate it. Three separate valuation frameworks, three separate methodologies, all pointing the same direction.
That’s not nothing.
| Valuation Metric | Current Level | Historical Average | How Stretched |
|---|---|---|---|
| Shiller CAPE | 41.6 | 17.3 | 140% above mean |
| Forward P/E | 21.1 | 18.9 (10-yr avg) | 12% above |
| Buffett Indicator | ~200%+ | ~100% | 2x historical norm |
| Equity Risk Premium | ~0.3% | ~3–4% | Near historic low |
Four separate frameworks. One direction.
But here’s where I stop following the terrifying camp and start pushing back.
The CAPE denominator includes ten years of earnings. Right now, that ten-year window stretches back to 2016. In 2016, Microsoft Azure was barely a rounding error in their financials. Apple’s services business was just getting started. Google Cloud was a distant third in a market that barely existed as a stand-alone category. Meta was mostly selling mobile ads to small businesses. The earnings that anchor the CAPE denominator reflect a technology industry that looks almost nothing like the one generating profits today.
If you’re going to use a ten-year average of earnings to judge whether today’s prices are justified, you have to reckon with the fact that the companies inside the S&P 500 have structurally different economics than they did a decade ago. A software business with 70% gross margins and near-zero marginal costs of serving another customer deserves a higher multiple than a manufacturing company with 35% gross margins and significant capital intensity. The index has shifted heavily toward the former.
This is the “this time is different” argument, and I know how that sounds. Every bubble in history has produced a version of it. 1999 had the “new economy” thesis. 2007 had “financial innovation has smoothed the business cycle.” I’m not saying the argument is correct. I’m saying it’s not crazy the way those prior ones were, because the underlying business model changes are real and measurable in ways that dot-com revenue multiples on companies with no profits simply weren’t.
The honest position is: yes, CAPE is stretched. Yes, some of the stretch is genuinely warranted by structural changes in index composition and corporate profitability. No, I can’t tell you with any precision what fraction is warranted versus speculative excess. Nobody can.
What I can tell you is what the historical data says about ten-year forward returns from this CAPE level, and it’s not comfortable.
Research across multiple time periods consistently finds that buying a CAPE-40 market produces significantly below-average real returns over the subsequent decade. Not always negative, but consistently below the long-run 10% annual average that gets cited in “just buy and hold” arguments. The median ten-year real return when starting from CAPE readings above 35 is somewhere in the low single digits. Some starting points produced positive nominal returns and negative real returns. Some produced nominal losses. The range is wide. The central tendency is poor.
The counterargument to this — which bulls make constantly and aren’t entirely wrong about — is that CAPE is a decade predictor, not a year predictor. You could have looked at CAPE in 1997, said it was dangerously elevated, and been technically right about the ten-year return picture while watching the index climb another 60% before the 2000 peak. The market can stay expensive for years. “Valuation is a terrible timing tool” is one of the genuinely true things people say about markets.
So the practical question isn’t “is the CAPE high” — it’s “given that CAPE is high, what does a rational investor actually do differently.”
And my answer to that is more boring than the valuation data would suggest.
I’m not reducing equity exposure dramatically. Let me explain that, because it probably sounds like I’m contradicting everything above.
The problem with a large-scale reduction to cash based on valuation is that it requires two correct decisions, not one. You have to be right that the market is overvalued. And you have to be right about when the market decides to care about that. I’ve been right about the first and wrong about the second enough times to have genuine humility about the second part. The investor who moved to cash at CAPE 32 in 2018 needed four years of patience and missed roughly 50% in index gains before the 2022 correction gave them any vindication. Four years is a long time to be right in theory and wrong in practice.
What I’m doing instead — and what I think makes actual sense given the setup — is being specific about what I’m buying within equities rather than treating the decision as binary.
The S&P 500 at CAPE 41.6 is not uniformly expensive. That average contains enormous dispersion. The large-cap technology names that dominate the index are trading at multiples that price in substantial continued growth. Some of them deserve those multiples. Some of them are riding the AI narrative in ways that have minimal connection to their actual current business results. Small-cap US stocks have underperformed large caps so dramatically that the Russell 2000’s forward P/E is meaningfully cheaper than the S&P 500’s — unusual historically and potentially an opportunity if you can tolerate the higher volatility.
International markets are something else entirely. European developed market stocks have CAPE readings in the 15-22 range depending on the country. Japanese stocks similarly. The valuation spread between the US and international developed markets is near historical extremes. The typical argument against international exposure is that US earnings growth is superior. That’s been true. But at CAPE 41.6 for the US versus 17 for Europe, you’re being asked to pay more than double for arguably better earnings quality. At what price differential does the quality premium stop being worth it? We may already be there.
This is where I land after sitting with the CAPE data for longer than I’d like to admit.
Owning equities broadly makes sense for most investors with long time horizons. The alternative — cash yielding 4-5%, bonds with duration risk in an uncertain rate environment — isn’t obviously superior over a decade, especially if you account for inflation eating into fixed-income returns. Markets can stay elevated for years.
But there’s a specific mistake that CAPE 41.6 environments tend to produce, and it’s worth naming clearly. The mistake is extrapolating recent US large-cap returns forward as if they represent the baseline expectation rather than a historically unusual outcome. From 2010 to 2025, the S&P 500 delivered roughly 13-14% annualized returns — well above the long-run 10% average, partly because valuations expanded from reasonable levels to extreme ones. That expansion is a one-time tailwind. It can’t repeat from CAPE 41 because you can’t expand your way from overvalued to more overvalued indefinitely.
A portfolio that worked brilliantly for the last fifteen years — heavy US large cap, growth tilt, minimal international exposure, minimal fixed income — has a different probability distribution of outcomes for the next fifteen than the recent track record implies. Not necessarily bad outcomes. Just different. Lower expected returns from current starting valuations, more sensitivity to multiple compression if anything disappoints, and an international equity segment that looks genuinely more attractive on a relative value basis than it has in years.
I’m not predicting a crash. The guy who sold everything at CAPE 35 is watching from the sidelines. I’m not doing that.
I’m just carrying an umbrella. And making sure I understand the difference between what this market has delivered recently and what it’s actually likely to deliver from here.
Those are two very different numbers.