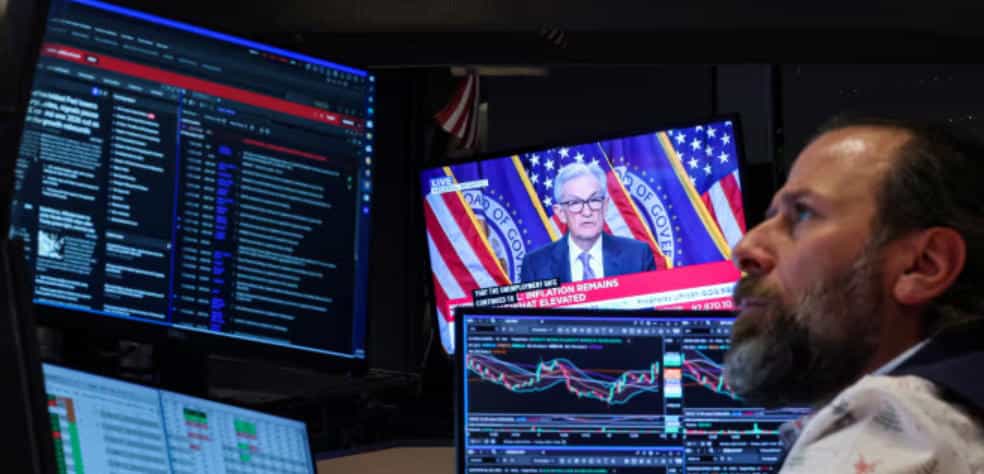
The Federal Reserve chairman spent much of 2024 and 2025 carefully engineering what looked like a textbook soft landing — six rate cuts totaling 175 basis points, inflation gradually retreating, the labor market slowing without collapsing. Markets responded by hitting new highs. The narrative was clean. The Fed had threaded the needle.
Then oil prices climbed more than 76% between February and early April 2026 because of a conflict in the Middle East that nobody fully saw coming, core PCE inflation bounced back toward 3%, and the Fed found itself holding a 3.50%-3.75% policy rate with essentially no good options. Cut rates and you risk reigniting the very inflation problem you spent two years suppressing. Hold rates and you apply continued pressure to an economy already absorbing tariff-related cost increases and a labor market that has softened more than the headline numbers suggest. Raise rates and you trigger the market reaction that every central banker since Volcker has tried to avoid repeating.
As of late May 2026, the Fed is choosing option two. Interest rate markets are pricing in a high probability that the current range holds through the remainder of the year. Powell’s term expires in May 2026, adding a layer of institutional uncertainty that doesn’t show up in the dot plot but absolutely shows up in how institutional investors position for the second half.
For stock market investors, this creates a specific set of conditions that require different thinking than either the rate-hiking environment of 2022 or the aggressive cutting cycle that followed. The playbook for this particular setup — rates stuck at a level that’s restrictive enough to matter but not high enough to break anything quickly — is less obvious than most financial commentary acknowledges.
The Equity Risk Premium Problem That Almost Nobody Is Talking About
Start with the number that frames everything else in the current market environment.
The S&P 500 closed at 7,209 on April 30, 2026. At that level, the forward earnings yield on the index — the inverse of the forward price-to-earnings ratio — sat near the 10-year Treasury yield of 4.40%. The equity risk premium, which measures how much additional return investors demand for holding stocks over risk-free government bonds, compressed to approximately 0.02% at certain points this year. By historical standards, that number is almost nothing.
The equity risk premium matters because it represents the compensation investors receive for taking on the additional volatility, uncertainty, and potential permanent loss of capital that equities carry relative to Treasuries. When that premium was 3% to 4% — as it was for much of the decade following the 2008 financial crisis — stocks offered a meaningful return advantage over bonds even after adjusting for risk. At 0.02%, they don’t. You are accepting substantially more risk than a Treasury bond for approximately the same expected return.
This doesn’t mean stocks will immediately decline. Equities can trade at thin risk premiums for extended periods when earnings growth is robust and investor confidence is high. The S&P 500’s price-to-earnings multiple has been elevated by historical standards for most of the post-2009 era without triggering the mean reversion that value investors kept predicting. But it does mean that the margin of safety in the broad index is essentially nonexistent at current prices, and that any negative earnings revision or macroeconomic surprise has almost no buffer to absorb it before stock prices have to decline.
An investor buying the S&P 500 at current levels is making a bet that earnings growth will be strong enough to bring the forward multiple down to reasonable levels over the next 12 to 18 months. That bet might be right. It’s also a bet with very little room for the story to disappoint.
How the Current Rate Environment Affects Different Parts of the Market
Not all stocks respond to interest rates the same way, and the heterogeneity of that response is exactly where investment opportunity lies in a stuck-rate environment.
The theoretical relationship between rates and stock prices runs through the discount rate applied to future earnings. When rates rise, future cash flows are worth less in present value terms — a dollar of earnings in five years is discounted more heavily when the risk-free rate is 4.4% than when it’s 1.5%. This mechanical relationship hits long-duration assets hardest: companies whose value is concentrated in earnings many years into the future, rather than in current profits, experience the most severe multiple compression when rates rise.
This explains why high-multiple growth stocks — companies trading at 40x, 50x, or 60x current earnings because markets are pricing in a decade of rapid expansion — are vulnerable in the current environment in a way that isn’t immediately obvious from reading their individual business stories. The business can be doing fine. The valuation can still compress if rates stay elevated longer than the market expected when it assigned that multiple.
Conversely, companies with high current earnings relative to their market values — low P/E multiples, high free cash flow yields — are less sensitive to rate movements because a larger portion of their intrinsic value is concentrated in near-term cash flows that don’t need to be discounted as far into the future.
How the current rate environment maps onto sector exposures:
| Sector | Rate Sensitivity | Why | Current Positioning |
|---|---|---|---|
| Technology (high multiple) | High negative | Valuation built on distant future earnings | Vulnerable if rates stay elevated |
| Utilities | High negative | Bond-like income profile, rate competition | Improving as cut expectations drift lower |
| Real Estate / REITs | High negative | Leveraged assets, rate-sensitive cap rates | Cheap on fundamentals, still fighting rate headwind |
| Financials (banks) | Moderate positive | Net interest margin benefits from higher rates | Benefits from current rate level |
| Energy | Low sensitivity | Driven by commodity prices, not discount rates | Geopolitical and supply dynamics dominate |
| Healthcare | Low sensitivity | Defensive earnings, limited leverage | Relatively attractive in high-rate world |
| Consumer Staples | Low sensitivity | Pricing power, essential demand | Dividends more competitive when Treasuries high |
| Industrials | Mixed | Capex benefits from reshoring, but debt costs rise | Select names with strong balance sheets |
The broad implication is that the rate environment in 2026 rewards selecting stocks with high current earnings quality over stories that depend on realizing potential earnings years from now. This isn’t a permanent strategic shift — if rates decline meaningfully, the positioning reverses. It’s a tactical adjustment appropriate for the specific environment the market is navigating.
The Inflation Story Nobody Is Reading Correctly
The inflation picture in 2026 is more complex than either the “inflation is dead, cut rates” camp or the “inflation is coming back, raise rates” camp acknowledges.
Core PCE inflation — the Federal Reserve’s preferred measure — peaked above 5.5% in 2022, then declined steadily through 2024 and early 2025 as higher rates slowed credit growth and supply chains normalized following the pandemic disruptions. By late 2025 the trend was encouraging enough that the Fed felt comfortable cutting rates three times in quick succession.
What changed is a combination of factors that are each individually manageable but collectively awkward for the Fed’s communication strategy.
Oil prices surged more than 76% in roughly six weeks between February and April 2026, driven by escalation in the Middle East that disrupted supply expectations. Oil doesn’t stay out of core inflation forever — it shows up in transportation costs, manufacturing input costs, and eventually in the prices of goods that move across the supply chain. The pass-through is slower than people expect but more durable than they account for.
Tariff-related price increases layered on top of the oil move in ways that are difficult to disentangle. When import costs rise because of deliberate policy rather than temporary supply disruption, the price increases don’t normalize the same way supply-shock inflation does. A tariff-driven price increase is permanent until the tariff is removed.
And the labor market, while softening, hasn’t softened enough to eliminate wage growth pressure in the sectors where labor is genuinely scarce — healthcare, skilled trades, and certain technology specialties where the AI buildout has created sustained demand for workers the economy cannot quickly produce.
None of these forces individually constitute a 2022-style inflation resurgence. Together, they constitute exactly the kind of “last mile” inflation problem that makes the Fed’s life miserable — inflation that has mostly been defeated but won’t fully comply, in an environment where the political and economic costs of additional rate hikes are high enough that the Fed is reluctant to apply them.
The market is pricing this as a benign stalemate: rates stay where they are, inflation gradually declines, cuts happen eventually, no recession. That outcome is possible. The alternative — that inflation proves stickier than this scenario assumes, and the Fed eventually has to choose between accepting above-target inflation or raising rates in a slowing economy — is also possible, and its probability is meaningfully underpriced by a market sitting at near-record equity valuations with a 0.02% equity risk premium.
What the Yield Curve Is Actually Telling You
The 10-year Treasury yield hovering near 4.4% while the fed funds rate sits at 3.50%-3.75% means the yield curve has returned to a more normal upward slope after spending an extended period inverted. An inverted yield curve — where short-term rates exceed long-term rates — has historically been one of the more reliable leading indicators of recession. Its normalization is often interpreted as a positive signal.
The interpretation deserves more nuance than it typically gets.
Yield curve uninversions happen for two different reasons, and they have opposite implications for equity investors. The first is the benign scenario: the economy is healthy, the Fed has successfully controlled inflation, long-term rates reflect reasonable growth expectations, and short-term rates decline toward them as the Fed cuts. This is the soft landing script.
The second is less benign: long-term rates rise — reflecting concerns about fiscal sustainability, inflation persistence, or term premium demand — while short-term rates stay elevated or only decline modestly. The curve steepens not because the economy is healthy but because bond investors are demanding more compensation to hold long-duration government debt.
In 2026, the second dynamic has been more prevalent than the first. The 10-year yield has been elevated not primarily because the economy is booming but partly because of concerns about the US fiscal trajectory — the combination of the Big Beautiful Bill’s projected debt additions, tariff revenue lost to court challenges, and ongoing defense and entitlement spending creating a debt path that bond vigilantes are beginning to notice.
When long rates rise for fiscal rather than growth reasons, the equity impact is different from rate increases driven by monetary policy. Monetary tightening can be reversed by the Fed when conditions warrant. Fiscal-driven rate pressure is more structural and less easily addressed within a single policy cycle.
The Fed Transition Risk Market Participants Are Underweighting
Jerome Powell’s term as Federal Reserve chairman ended in May 2026. His successor’s identity and philosophy were known in advance, but the transition itself introduces a category of institutional risk that markets tend to underweight until it materializes.
The Fed’s credibility — its ability to anchor inflation expectations through forward guidance and signaling — is partly a function of the institution and partly a function of the specific individuals running it. When a new chair takes over, particularly in an environment where the inflation path is uncertain and political pressure on monetary policy is explicitly present, the bond market’s trust in forward guidance has to be re-established rather than assumed.
This doesn’t mean the new Fed leadership will make policy mistakes. It means that the communication premium the Fed’s credibility earns — the ability to move markets through statements before actions — has to be rebuilt through demonstrated consistency rather than inherited automatically. That process takes time, and during it, monetary policy communication tends to produce more market volatility per statement than investors expect based on prior periods.
For equity investors, the practical implication is that Fed-related market volatility should be expected to be somewhat higher in the second half of 2026 than recent years’ patterns would suggest. Not catastrophically so, but enough that position sizing around Fed meetings deserves more conservatism than a simple extrapolation of recent experience would produce.
Sector Rotation in a Stuck-Rate World: Where the Opportunities Actually Are
Given everything above — elevated rates with limited cut expectations, compressed equity risk premium, sticky inflation preventing policy easing, and institutional uncertainty at the Fed — the question that actually matters for an equity investor is where to look.
The answer isn’t complicated, but it requires accepting that it’s not very exciting.
Companies generating high free cash flow relative to their market values right now — not projected free cash flow in three years, actual free cash flow today — are structurally advantaged in this environment. Their intrinsic value is less dependent on discount rate assumptions, their dividends and buybacks are funded by real cash rather than financial engineering, and their earnings aren’t relying on the rate cuts that may not materialize on the timeline the market expects.
The financial sector deserves more attention than it typically gets from retail investors focused on technology. Banks earning net interest margins that benefit from rates staying in the 3.50%-4.00% range, particularly those with strong deposit franchises and conservative balance sheets, are generating earnings that look significantly more attractive relative to their valuations than they did during the zero-rate era. The risk — that a recession reduces credit quality — is real, but with unemployment still relatively contained, the probability-weighted earnings picture is more favorable than the sector’s reputation among retail investors implies.
Healthcare combines defensive earnings characteristics with structural tailwinds from aging demographics that are independent of the rate cycle. Pharmaceutical companies with approved drugs generating current cash flow, medical device manufacturers with recurring revenue from consumables, and healthcare services businesses with essential demand profiles all share the characteristic of having intrinsic value concentrated in near-term earnings rather than distant future projections.
What to be careful about: companies whose earnings narratives depend on rate cuts that may be delayed. Any business model that only makes sense if borrowing costs decline meaningfully — highly leveraged real estate developers, companies with variable-rate debt loads that are currently consuming significant free cash flow, or consumer-facing businesses where demand depends on the credit availability that lower rates enable — carries scenario risk that current stock prices may not fully reflect.
This is not an argument for defensiveness as a permanent investment posture. Rates will eventually decline further. The AI infrastructure buildout provides genuine earnings growth across multiple sectors. The US economy has demonstrated resilience that exceeded most economists’ expectations repeatedly over the past four years. But in the specific environment of May 2026 — a market at record valuations with a near-zero equity risk premium, inflation that won’t fully comply with the script, and a Fed that’s stuck between competing risks — the risk of being wrong about the macro is higher than the price of the broad market acknowledges.
The Practical Checklist Before You Add Market Exposure Here
Rather than ending with a paragraph of synthesis that sounds polished but doesn’t help you make actual decisions, here’s a specific checklist worth running through before adding meaningful new equity exposure at current levels.
| Question | What a Yes Means | What a No Means |
|---|---|---|
| Does this company generate positive free cash flow today? | Lower sensitivity to rate environment | Re-evaluate; future earnings dependent on rate path |
| Is the P/E below 25x on current-year earnings? | Reasonable valuation buffer | Multiple compression risk if rates stay elevated |
| Does revenue depend on consumer credit availability? | Rate risk embedded in demand | More vulnerable if cuts delayed further |
| Is net debt-to-EBITDA below 2.5x? | Balance sheet can absorb rate pressure | Leverage amplifies any earnings weakness |
| Has the company maintained or grown its dividend through two prior rate cycles? | Demonstrated durability | Dividend safety needs verification |
| Is the earnings estimate for next year based on conservative or aggressive macro assumptions? | Estimate likely to hold | Estimate at risk of downward revision |
None of these criteria guarantee a good investment. Together, they filter for the category of companies whose performance is least dependent on the macro environment resolving favorably — which is the most honest way to describe the current uncertainty.
The Fed is stuck. Inflation won’t fully die. The equity risk premium is almost nonexistent. That doesn’t mean you sell everything and wait. It means you’re more selective than you might have been when every economic indicator was pointing in the same direction.
Those environments come around eventually. This isn’t one of them.