
Marvell lost $1.02 a share in fiscal 2025 and earned $3.07 in fiscal 2026. That is a 4.09 swing in twelve months, from a company whose critics spent two years asking whether its custom AI chip work was a costly detour from the networking business that paid the bills.
The stock now answers that question for them, at least on price: $244.25, up 246% from its 52-week low of $71, though still 25.9% under the high of $330. Whether the market is right depends on which line of the income statement you believe, and the two most important lines here do not agree with each other.
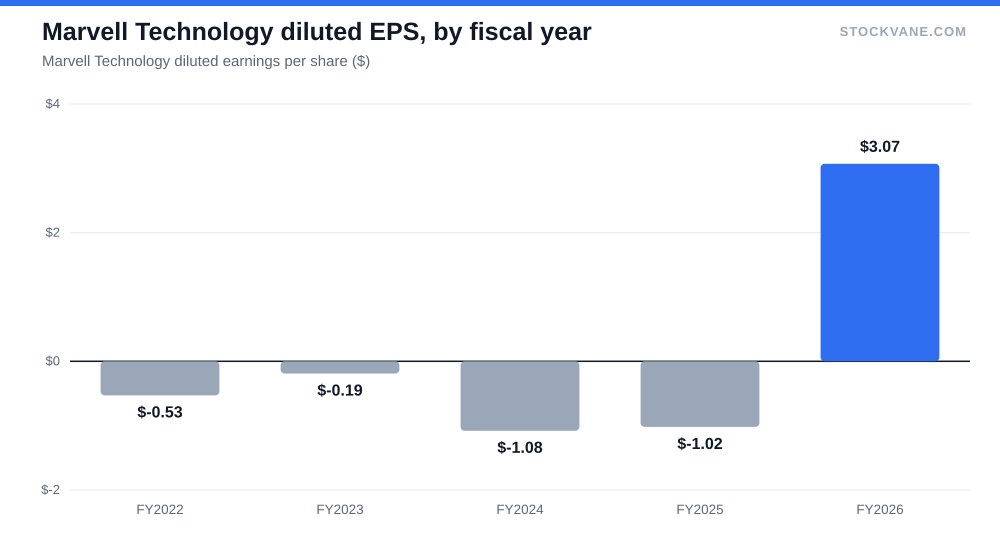
My view, stated early: the financial record says custom silicon was not a distraction, because revenue, gross margin and operating profit all turned within the same year. But the price already treats that as settled, and the profit figure that makes the year look extraordinary is about twice as large as the operating profit underneath it. I would wait for that gap to be explained before paying up.
Three years of red ink, then one year that reversed all of it
The financials tab shows the path. Revenue was $5.9 billion in fiscal 2023, fell to $5.5 billion in 2024, edged up to $5.8 billion in 2025 and jumped to $8.2 billion in 2026, a gain of 42%. Net income went from a $164 million loss in 2023 to losses of $933 million and $885 million in the next two years, then to $2.7 billion in 2026.
The gross margin moved with it. It was 41.3% in fiscal 2025 and 51.0% in fiscal 2026, a rise of 9.7 percentage points, and it is back at the level of fiscal 2023’s 50.5%. For a chip company, gross margin rising while revenue grows 42% is the pattern you want: it says the growth was not bought with discounts. It does not say which product drove it.
That is the limit of what I can show. The database carries Marvell as a single reporting segment, so there is no revenue line for custom silicon or for the legacy networking and storage business. Anyone who tells you the custom chip programs produced a given share of the growth is working from company commentary, not from the numbers I have. What the data does show is timing: the operating loss of $370 million in 2025 became an operating profit of $1.34 billion in 2026, a swing of about $1.7 billion on $2.4 billion of extra revenue.
Two profit numbers that do not match
Here is the part I keep returning to. Net income for fiscal 2026 was $2.7 billion. Operating income was $1.3 billion. Net income is 2.0 times operating income, which is unusual, since interest, taxes and other items normally subtract from operating profit rather than add to it.
Something outside operations added roughly $1.3 billion to net income. The database does not say what. It could be a gain on a sale, a tax benefit or an investment mark; I cannot tell which, and the answer changes the story. If it is a one-time item, then $3.07 of EPS overstates what the business earns in a normal year, and the trailing P/E of 80.9 is calculated on a figure that will not repeat. The database also lists an EBIT margin of 39.7%, well above the 16% you get by dividing operating income by revenue, which points to the same definitional gap. I use the operating margin below, because it is the one I can reproduce.
Read the operating figures alone and the picture is still good, just smaller. A 16% operating margin after three years of losses is a large change. That margin also leaves a company valued at $214.2 billion at roughly 160 times fiscal 2026 operating income.
What the multiple asks you to believe
The valuation tab puts the P/E at 74.4 on its own measure, the 96th percentile of a five-year band. The five-year average P/E is negative, -134.1, because the company was losing money for most of the period, so it is useless as a benchmark. The comparison that works is the industry: the group average P/E is 30.9, well below Marvell’s 74.4. The forward P/E of 66.1, based on $3.70 of expected earnings, is lower but still more than twice the group.
| Metric | Value | Context |
|---|---|---|
| Price (approx.) | $244.25 | 52-week range $71 to $330 |
| P/E (TTM) | 80.9x | Five-year average -134.1x |
| Price-to-sales | 20.9x | Five-year average 11.5x |
| Analyst ratings | 85% buy, 15% hold | 26 analysts; average target $302 |
| Dividend yield | 0.10% |
Price-to-sales tells a similar story. At 20.9 times sales against a five-year average of 11.5 and an industry figure of 13.5, the stock is in the 95th percentile of its own range. Price-to-book is 10.6, also at the 96th percentile of its history, though the industry average of 12.5 is higher, so on that one measure Marvell is not out of line with its group.
Forward earnings of $3.70 imply 22% growth over trailing EPS. Revenue is growing faster than that. Revenue for the July quarter, the second of fiscal 2027, was $2.7 billion, up 37% from a year earlier and 13% above the prior quarter’s $2.42 billion. Annualized, that is $11.0 billion, or 34% above fiscal 2026’s revenue. So analysts are modeling earnings growth well below sales growth, which is consistent with my suspicion that the reported fiscal 2026 EPS is flattered.
For a sense of what a full rerating would mean, suppose the shares fell to the industry P/E of 30.9 on the forward EPS. That is $114, or 53% below the current price. I do not think that is a forecast, since a company growing sales in the high 30s deserves a premium to a group that includes slower businesses. It is the size of the premium that is now in the price.
How the market has reacted, and who is on the other side
The reports themselves have produced large moves. The stock has moved 9.9% on average after earnings, up or down, and the last four one-day reactions were +7.9%, +18.4%, +3.1% and then -10.3% after the August 27 report. That last one matters. Revenue was growing 37% and the stock fell more than 10%, which means the market was paying for more than a strong print. When a stock falls on 37% growth, the expectation was higher than 37%.
Analysts remain firmly supportive. 85% of the 26 covering the stock rate it a buy, none say sell, and the average target of $302 is 24% above the price. The low target of $245 sits at the current price, so the most cautious analyst sees no upside, while the high of $400 implies 64%. Short interest is 4.4% of float. The StockVane quant grade has moved from C on September 8 to A, a fast change in under two weeks, though I would not read a quant grade as more than a summary of recent data.
For context on where this sits in the wider buildout, see our look at AI infrastructure stocks, which asks who profits from the AI spending wave. Marvell is one of the companies that question is about. A useful comparison for how a rich multiple gets tested is Oracle’s backlog against its share price: both stocks are priced on contracted or expected growth that the reported results have not yet fully delivered.
What I am not covering, and what would make me wrong
I am not sizing the custom silicon pipeline, customer concentration, or the competing chips from other designers, because the database has no figures for them and I would be guessing. Any of them matters more to the long-run thesis than a single fiscal year of results.
The way I could be wrong is simple. If the extra $1.3 billion in net income turns out to be recurring, whether from interest income or a lower tax rate, then the earnings base is real, the forward P/E of 66.1 is closer to fair for a company growing this fast, and my caution costs me the move. If operating margin keeps rising toward 20% while revenue keeps growing above 30%, the premium is earned.
The opposite case is a slowing quarter. Revenue growth is 37% now. A print near 15% would leave a company at 20.9 times sales with a growth rate that does not fit the multiple, and the stock could fall much further than the 10% it lost in August.
The operating line I would wait for
Genius or distraction is the wrong frame. A strategy this large is judged by margins, and the fiscal 2026 margin is one year of evidence against three years of losses. The test I would apply is the fiscal 2027 operating margin. Above 20% with revenue growth still north of 30% and I would accept that the bet is paying, and that a premium multiple is defensible. Stay near the 16% of fiscal 2026 while sales keep rising and the reading is that the extra profit came from outside the operating business. The next report is where I would look first, at the operating line before the EPS line.
Financial disclaimer: The content on StockVane is for educational and informational purposes only and should not be construed as professional financial advice. Stock market investing involves risk of loss.
Sources: Dividends (SEC Investor.gov glossary) (https://www.investor.gov/introduction-investing/investing-basics/glossary/dividend) · Dividends tax topic (IRS) (https://www.irs.gov/taxtopics/tc404)