
Vertiv gained 24.5% in one session on February 11, the day it reported its fourth-quarter results. Five months later, on July 29, it lost 17.3% on the second-quarter report. Same company, same customers, and a 42-point swing between two earnings days.
I would not trade that. I would want to understand why a business with a 100% buy rating from all 15 covering analysts can move like that, because the answer says what kind of stock this is. It is the picks-and-shovels position on AI infrastructure, priced accordingly, and the price leaves less room for error than the label suggests.
My view, stated early: Vertiv’s results back the label. Sales roughly doubled in four years and profit grew faster than sales. But at 56.4 times trailing earnings and 8.1 times sales, the shares now cost more than their own history on the measure that matters for a hardware company, and a single soft quarter is enough to take a fifth of the value off. I would own it in size only if the entry price left a cushion.
What the numbers say about the trade
Vertiv makes power distribution and cooling equipment. The company does not disclose to me, and our data does not show, exactly which end markets drive each dollar of revenue, so I will keep to what is measured. Revenue was $5.0 billion in 2021 and $10.2 billion in 2025, which is 2.0 times as much. The 2025 figure grew 28% on $8.0 billion in 2024, the fastest yearly rate in the five-year run.
Growth has been stepping up rather than holding steady: 14% in 2021, 14% in 2022, 21% in 2023, 17% in 2024 and 28% in 2025. Only 2024 broke the run. That matters because equipment businesses with an order book tend to accelerate late in a build-out and slow when orders are digested.
Profit did the heavier lifting. Operating income rose from $0.27 billion in 2021 to $1.9 billion in 2025, 7.0 times higher on revenue that grew 2.0 times. On the financials tab that shows as an operating margin of 5.4% in 2021, 4.0% in 2022, 13.4% in 2023, 17.2% in 2024 and 18.6% in 2025. Our data’s own EBIT margin for 2025 is 17.9%, because it treats a few items differently; I quote the operating-income version and flag the difference so nobody is surprised by it.
| Metric | Value | Context |
|---|---|---|
| Price (approx.) | $249.39 | 52-week range $134 to $380 |
| P/E (TTM) | 56.4x | Five-year average 81.0x |
| Price-to-sales | 8.1x | Five-year average 4.1x |
| Analyst ratings | 100% buy, 0% hold | 15 analysts; average target $342 |
| Dividend yield | 0.09% |
Gross margin tells a more measured story than the operating line. It was 36.3% in 2025 against 36.6% in 2024, essentially unchanged after a climb from 28.4% in 2022. So the recent gain in operating margin is coming from spreading fixed costs over more sales, and much less from higher prices or a better mix. That is good, and it can also stop. Fixed-cost absorption works until volume slows, and then it runs in reverse.
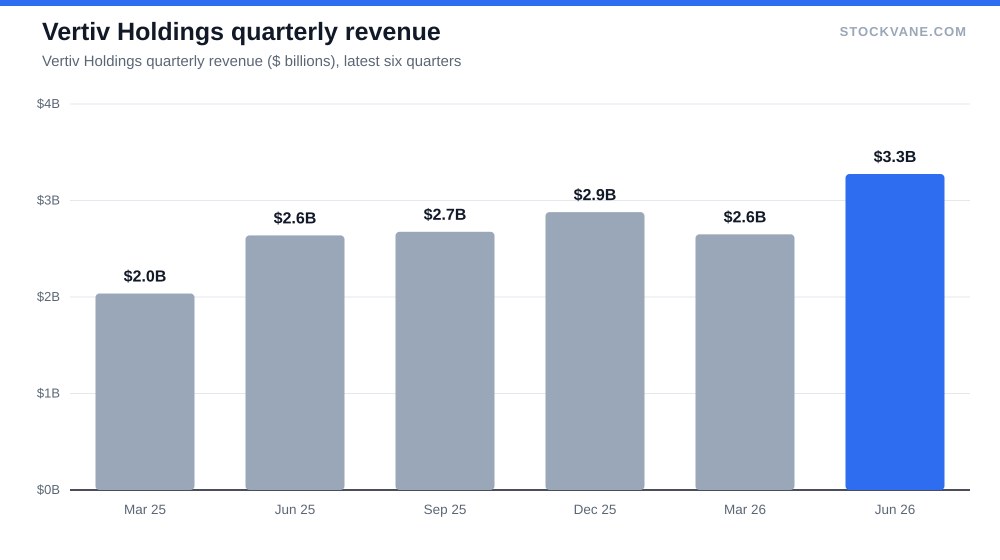
The latest quarter, per the same page, brought $3.3 billion in revenue, 24% above the prior year and up 24% from the quarter before. The Products line is about 80% of quarterly revenue and Services and spares about 20%. That 20% is the smaller and steadier piece; a base of installed equipment that needs maintenance and parts is a fair cushion, though at this scale it does not offset a slump in new equipment.
The multiple and the rating
Vertiv’s trailing P/E is 56.4. The forward P/E is 34.3, so the market is paying up for a profit line that consensus expects to grow about 64%, from $4.42 to $7.27 per share. The gap between those two multiples is a factor of 1.6. On earnings that would be a fair price only if the forecast holds; a shortfall of a few points in that EPS turns 34 into 40 fast.
The five-year comparison is less flattering than it first looks. The P/E average of 81.0 is inflated by the years when earnings were close to zero, so I would not treat today’s 54.6 as cheap because it sits below that number. Price to sales is the cleaner gauge here. The valuation tab puts it at 8.1 against a five-year average of 4.1, in the 88th percentile of its own range, and the industry average is 5.3. The stock is priced above both. Price to book, at 19.5 against 14.0, tells the same story.
Then the analysts. All 15 rate it a buy, none rate it hold or sell. The analysts page shows an average target of $342, which is $93 above the price of $249 and 37% on percentage terms; the low target is $300 and the high $381. Even the lowest analyst sits about 20% above the current quote.
I put less weight on unanimity than most people do. A rating list with no dissent means nobody has left to upgrade, and a stock that has already climbed 87% from its 52-week low of $134 has shown what the consensus is worth. What I take from it is that the next surprise, if there is one, is more likely to be negative than positive.
What could go wrong
The specific risk is order timing. Equipment makers in a build-out cycle report strong revenue while their customers are still committing capital, and then a quarter arrives when a few large projects slip. The 17.3% drop after the July report fits that pattern, though our data does not attach a cause to it and I will not invent one. What I can say is that revenue that quarter still grew 24% and the stock fell anyway. The reaction was about the size of the expectations rather than the size of the miss.
The second is the tension in the rate outlook. A stock at 8.1 times sales is sensitive to what long-term yields do, which is why our note on the September 16 Fed hike matters here even though Vertiv sells equipment and not money. Higher rates pressure the multiple; a reversal would help it.
Short interest is 3.6% of float, about three days to cover. A squeeze is not the risk.
Insiders were the second thing I checked. A director sale was reported on the September 3 news feed. I mention it only as a fact and attach no reading to it.
What a bad quarter costs
Some arithmetic helps here. From $249, the average target implies a gain of $93 a share. The 52-week high is $380, and the stock now sits 34.3% below it, so the shares have already been through a drawdown of that size in the past year without any change in the annual figures. A holder who bought at the high and watched a 17% one-day drop on top would have needed the numbers to keep improving for a long time just to break even.
That is the asymmetry I mean. When a stock trades at 8.1 times sales, a quarter that merely meets expectations gives a modest gain. A quarter that misses takes off a fifth. The payoff is lopsided, and no rating list changes it.
Compare the alternative use of the same capital: a business at a lower multiple with slower growth can absorb the same disappointment with a smaller drop. I am not saying Vertiv is a bad company. I am saying the entry price is doing the work that the business used to do.
The recent quarterly path helps calibrate this. Quarterly sales were $2.68 billion and $2.88 billion in the two 2025 periods on our data, then $2.65 billion and $3.3 billion in the 2026 quarters, growing 30% and 24% from a year earlier. Growth of 30% and then 24% is still fast, but the rate is coming down, and a decelerating rate is exactly what a stock at this multiple has to survive. I read the July reaction as the market pricing that slope, not the level.
What I am not covering
Customer concentration, backlog dollars and the split of revenue by region. Our data carries none of them for Vertiv, and each would sharpen the case. I have also not compared it with power-equipment peers on margin, because the peer set is a judgment call and I would rather show the company against its own history.
The gross margin line that decides the multiple
The number I would follow is gross margin. It has held near 36% for two years, so operating margin above 18% has depended on volume and cost control alone. If it stays at or above 36% while revenue growth stays above 20%, the 34.3 forward multiple is defensible and I would add on weakness toward $134-to-$200 territory. If gross margin drops below 34%, then the equipment mix or pricing is weakening, the growth premium fades, and a stock at 8 times sales has no floor I can name. I would look at that line first in the next report.
Gavin Thorne has invested in U.S. stocks for six years and previously worked at a large publicly traded internet company. He writes about income-oriented strategies, including cash-secured puts, and about how he reads company data. This article reflects his personal research process and is for informational purposes only. It does not constitute investment advice.
Sources: Dividends (SEC Investor.gov glossary) (https://www.investor.gov/introduction-investing/investing-basics/glossary/dividend) · Dividends tax topic (IRS) (https://www.irs.gov/taxtopics/tc404)