
Between 2022 and 2025, Enterprise Products Partners’ annual revenue moved inside a range of about $8.5 billion, from $49.7 billion in 2023 to $58.2 billion in 2022. Its net income moved inside a range of $0.35 billion. Revenue swung roughly 24 times more than profit, and that ratio is the whole reason a partnership in a commodity-linked industry has raised its payout for approximately 26 years running.
The units closed at $38.89 on September 18, 2.0% below the 52-week high and 38% above the low. The distribution yield is 5.63%. Our question here is narrower than “is this a good income stock”: how much of that stability is already in the price?
Our read: the streak is real and the earnings behind it are unusually steady, but at 13.5 times trailing earnings the units cost more than they have on average, and the yield leaves less room for error than the streak implies.
Why revenue is noise and profit is not
Enterprise moves and processes crude oil, natural gas liquids, petrochemicals and refined products. It reported $52.6 billion of revenue in fiscal 2025, down 644% from $56.2 billion in 2024, and the year before that it grew 13%. Look further back and the swings get wilder: minus 17% in 2020, plus 50% in 2021, plus 43% in 2022, minus 15% in 2023.
Net income tells a different story. It was $5.62 billion in 2022, $5.66 billion in 2023, $5.97 billion in 2024 and $5.88 billion in 2025. The financial statements show the same thing at the per-unit level: diluted EPS of $2.50, $2.52, $2.69 and $2.66.
Most of what Enterprise earns is a fee. It charges to move, store and fractionate barrels it often does not own, under long contracts, so a swing in the price of oil changes the revenue line by billions and the profit line by very little. The gross margin, 13.6% in 2025 against 12.8% a year earlier, is thin because the revenue figure includes the value of the commodities passing through. The number that matters is the dollars left over, and those have been remarkably flat.
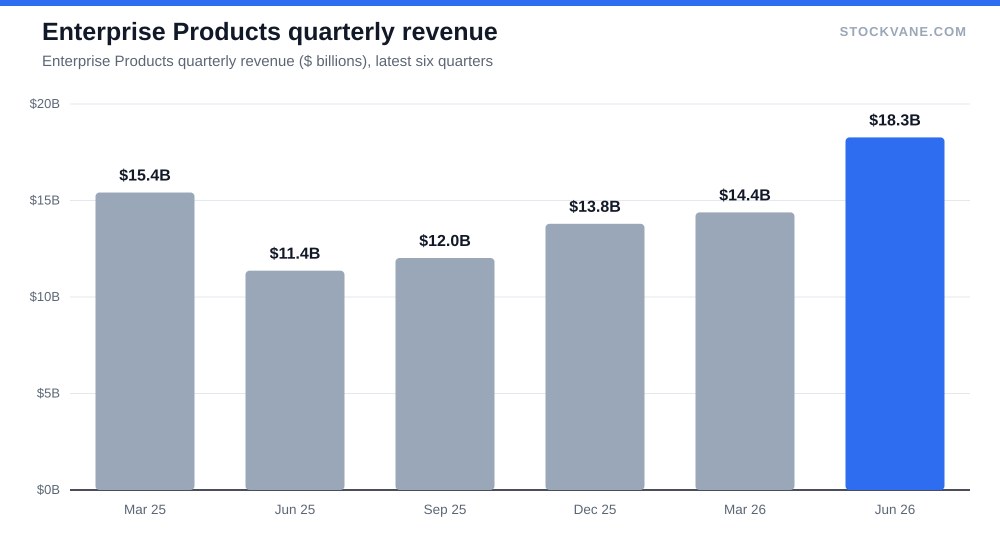
The latest quarter is a useful demonstration. Revenue for the June quarter came in at $18.3 billion, up 61% from a year earlier and 27% above the previous quarter. A reader who looked only at that line would conclude something dramatic had happened. Probably it was mostly prices. I would not extrapolate anything from that headline, and I would wait for the profit figure before drawing any conclusion.
The segments, and the intersegment trick
Enterprise reports four segments. In the June quarter, crude oil pipelines and services showed $25.3 billion of revenue, natural gas liquids pipelines and services $23.9 billion, petrochemical and refined products $13.5 billion, and natural gas pipelines $0.9 billion. Those add up to about $63.6 billion. The company then eliminates $45.3 billion of intersegment sales, which is how it arrives at the $18.3 billion reported total.
That is a useful figure to keep in mind. Roughly 71 cents of every dollar of segment revenue is the company selling to itself, for example NGLs produced by one part of the business and moved or processed by another. The integration is the moat. A competitor that owns only a pipeline cannot capture the same margin as one that owns the well-head gathering, the fractionator and the export dock.
What the payout looks like against earnings
The distribution went from about $0.535 per unit in April 2025 to $0.56 by July 2026, a rise of roughly 4.7%. Slow. Over the last twelve months unitholders received $2.19 per unit against trailing earnings of $2.89, so the payout takes about 76% of earnings. On the analyst forward estimate of $3.05, it is 72%.
That is a comfortable ratio but not a fat one. For a partnership, earnings per unit understates cash generation because depreciation is a large non-cash charge, and the metric the company itself uses, distributable cash flow, is not in the data set I used. So a coverage ratio built from EPS is conservative, and I flag it as an approximation. If the true cash coverage is well above 1.0, which the long record suggests, the payout is safe. If I am wrong, the first sign would be growth in the distribution slowing below the roughly 5% pace it has held.
Compare this with the sector. Our piece on Exxon argues that discipline, not the oil price, drives returns in big energy. Enterprise is that idea in its purest form: the fee-based structure is the discipline. And for readers who want the utility version of a steady payer, NextEra sits at the opposite end of the growth-versus-yield trade.
A word on what the streak does and does not prove. Twenty-plus years of increases says the partnership has never been forced to choose between the payout and the balance sheet, and that is worth a premium in a sector where dividend cuts have been common. It says nothing about the next twelve months. The size of each raise matters more than its existence: a rise of a few cents a year keeps the record alive at almost no cost to the company, so the streak is partly a promise management can afford to keep. I care more about whether raises stay near 5% while volumes grow than about the count of years.
Paying 13.5 times for a boring business
Here the case gets harder. The trailing P/E is 13.5, 1.14 times the five-year average of 11.8. The stock sits at the 90th percentile of its own range. Forward earnings put the multiple at 12.8, still above the average. Price to book is 2.8 against 2.3, the 96th percentile, and price to sales is 1.4 against 1.2.
Against its industry, the picture is friendlier. The industry average P/E is 16.4, so Enterprise trades at about 82% of that on trailing earnings. That is the argument for owning it. My objection is that the industry average includes companies with commodity exposure that Enterprise lacks, so a discount to the group is not automatically a bargain. Quality earns a premium, and Enterprise has been given one.
What does 5.63% buy you? If the distribution grows about 4.7% a year and the multiple holds still, total return is around 10%. If the multiple slides back to its average of 11.8, the price falls by 13%, and it would take more than two years of distributions to make that loss back. Unit prices in this sector do not usually deliver a big move either way. The return is mostly the yield.
What the Street and the tape say
Ten analysts cover the units. Four in ten say buy, six say hold, none say sell. The average target is $42, which is 8% above the price; the lowest target of $39 is level with it, and the highest, $48, is 23% above. A range that starts at zero upside and tops out at 23% describes a stock the Street regards as fairly priced.
| Metric | Value | Context |
|---|---|---|
| Price (approx.) | $38.89 | 52-week range $28 to $40 |
| P/E (TTM) | 13.5x | Five-year average 11.8x |
| Price-to-sales | 1.4x | Five-year average 1.2x |
| Analyst ratings | 40% buy, 60% hold | 10 analysts; average target $42 |
| Dividend yield | 5.63% |
Short interest is 1.1% of float, with about 8.9 days of normal volume needed to cover it, which is a long stretch for a name this large but not a bearish crowd. The last earnings report, on 2026-07-30, produced a one-day move of -1.4%, and the average earnings-day move is 2.0%. The quantitative score in our tools has improved from D to C. None of this points to a crowded trade.
What would make us wrong
Two things could do it.
The first is a fall in volumes. Fee-based income depends on barrels and molecules moving through the system, and if producers cut activity for a sustained period, the tariff income would follow, whatever the contract structure says. Net income slipped 2% in 2025, from $5.97 billion to $5.88 billion, and a second year of decline would be the first real evidence that the plateau is turning into a slope.
The second is a rise in rates or a change in tax treatment. Units priced on a 5.6% yield compete directly with Treasury bills, and the K-1 tax filing that comes with a partnership can put off some buyers, especially those holding it in a retirement account. A higher risk-free rate resets what investors demand from every income security, and a partnership yielding 5.6% with modest growth has less cushion than one yielding 8% with the same growth; the multiple, now in the 90th percentile of its own range, is exactly what compresses first. I do not cover either factor’s numbers here because the data is outside what I can verify, and I would rather say that than guess.
For how I screen for durable payers in the first place, see my stock selection process.
The payout ratio I would hold it to
At $39 and a 5.63% yield, Enterprise is a fair price for an excellent income record, not a mispricing. I would buy more comfortably near the low $30s, where the yield passes 7% on the current distribution. And I would start to worry if trailing payout climbs above 80% of EPS while net income stays under $6 billion, because that is the point at which growth in the distribution has to be funded from something other than growth in profit.
Financial disclaimer: The content on StockVane is for educational and informational purposes only and should not be construed as professional financial advice. Stock market investing involves risk of loss.
Sources: Dividends (SEC Investor.gov glossary) (https://www.investor.gov/introduction-investing/investing-basics/glossary/dividend) · Dividends tax topic (IRS) (https://www.irs.gov/taxtopics/tc404)