
Disney’s latest quarter brought in $25.2 billion in revenue, up 7%, and net income of $2.8 billion, down 52% from a year earlier. Both statements are accurate, and the stock, at about $102.67, is trading somewhere between the two of them.
My view is that streaming has already done the job it was hired for, which was to turn from a cash drain into a profit line. The debate has moved. What the market is arguing about now is ESPN, the parks, and whether an earnings figure that fell by half is a warning or a comparison problem. I lean toward comparison problem, with one caveat about sports that I will get to.
The question changed while the headline stayed the same
The old framing, cable declining and streaming rising, made sense when Disney reported them as separate businesses. It no longer reports them that way. The most recent quarter splits the company into Entertainment at $11.3 billion of revenue, Experiences at $10.0 billion and Sports at $4.5 billion, roughly 45%, 39% and 18% of the total before a small elimination line. Linear channels now sit inside Entertainment and Sports, next to the streaming services they are supposed to feed.
Because linear sits inside those segments, the cable decline no longer has a line of its own, and the profit figures have to carry the argument. Disney’s own release puts Entertainment operating income at $1.68 billion, up 64%, mostly on higher subscription and affiliate fees, and direct-to-consumer operating income at $712 million on a 12.9% margin, according to the company’s quarterly commentary. The company itself warned that some of that margin came from the timing of marketing and programming spend, so I would not draw a straight line from 12.9% into next year. But a streaming business that earns a double-digit margin is not the business that burned cash in 2022.
Experiences deserves its own sentence. Its revenue was $10.0 billion, up 10% and a record for a fiscal third quarter. A segment growing that fast at that size is much of the reason I am not worried about the multiple. It also means a good part of the earnings that have to replace linear come from ticket and hotel pricing and not from anything in media, which ties the stock to a healthy consumer as much as to a healthy streaming business.
Profit rose on sales that barely moved
The financials tab tells the longer story. Annual revenue went from $82.7 billion in fiscal 2022 to $94.4 billion in fiscal 2025, a gain of about 14% over three years, and growth in the last year was only 3%. Operating income over the same stretch went from $6.8 billion to $13.8 billion, a gain of about 104%. The operating margin moved from 8.2% to 14.6%.
Sales rose 14% and operating profit doubled. That is what happens when losses shrink in one segment while a high-margin segment keeps raising prices, and it is the best evidence I have that the transition shows up in dollars. It is also a limit on the story. A company that has grown revenue 3% a year cannot keep doubling profit by cutting losses, because at some point there are no losses left to cut. From here the margin has to come from growth, and growth is where the debate lives.
A P/E on falling earnings, a forward P/E on rising ones
On the valuation tab the trailing P/E is 21.2 and the forward P/E is 15.6, against an industry average of 24.8. Divide the price by each and you get trailing earnings of about $4.85 a share and expected earnings of about $6.56. Analysts are pricing in a rebound of roughly 35% in earnings per share.
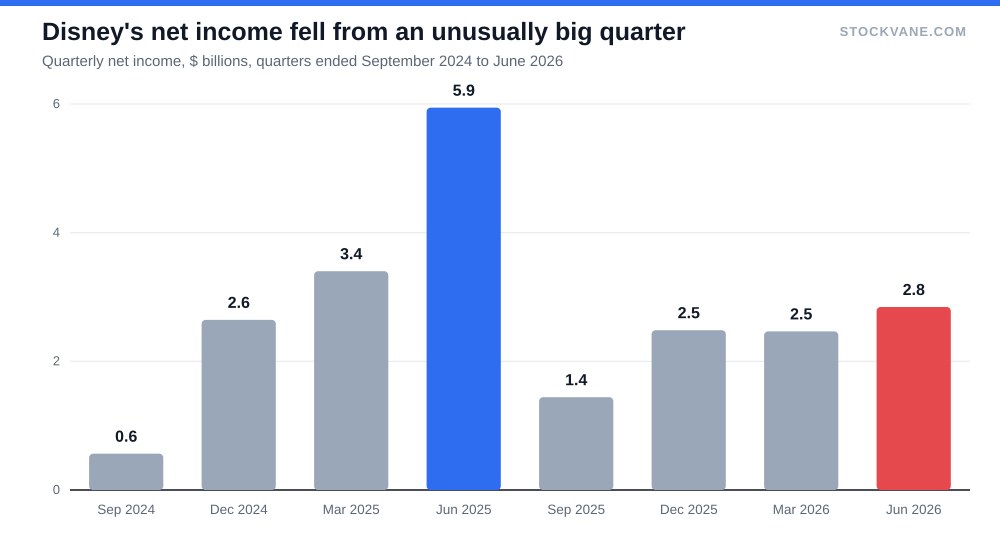
The chart shows why the trailing number looks strange. Quarterly net income hit $5.9 billion in the June 2025 quarter then dropped to $1.4 billion in the September quarter and has run between $2.5 billion and $2.8 billion in the three quarters since. The year-earlier figure was unusually large, and our data does not say why, so I will not guess at the cause. What I can say is that comparing $2.8 billion with $5.9 billion produces a 52% decline that describes an outsized comparison quarter more than it describes a business that lost half its earning power. Revenue did not fall, and annual operating income has kept rising.
The five-year average P/E of 59.9 on the same page is useless for the same reason: it is dragged up by the pandemic years, when Disney’s earnings were close to zero. I would ignore it and use the forward figure and the peers instead.
| Company | Trailing P/E | Forward P/E | From 52-week high | Quant grade (score) |
|---|---|---|---|---|
| Disney (DIS) | 21.2x | 15.6x | -11% | D (17) |
| Netflix (NFLX) | 22.6x | 23.0x | -43% | E (2) |
| Comcast (CMCSA) | 7.3x | 7.4x | -29% | E (10) |
| Warner Bros. Discovery (WBD) | n/m | n/m | -7% | B (79) |
Next to its peers, Disney looks middling to cheap. Netflix trades at 22.6 times trailing earnings and Comcast at 7.3. Warner Bros. Discovery has negative trailing earnings, so its multiple means nothing. Disney at 15.6 times forward earnings is not a bargain in an absolute sense, but it sits well below the roughly 23 times that the market charges Netflix, and it owns parks that Netflix cannot replicate.
ESPN is the piece that has to work
The ESPN direct-to-consumer service launched on August 21, 2025 at $29.99 a month for the unlimited plan, and that price shows how big the gap is between what cable used to collect on ESPN’s behalf and what a person will pay when asked directly. Every cable household once paid an affiliate fee whether anyone watched a game or not. A standalone app has to replace that money with people who actually want sports.
The latest quarter shows the tension. Sports revenue was $4.5 billion, up 4%, yet operating income fell 17% to $858 million, a drop Disney attributed partly to several early-round NBA playoff series ending faster than the year before. Viewership was strong, with NBA Finals ratings at a 28-year high, but rights costs are fixed and playoff games are not. I do not have ESPN’s full rights schedule in front of me, so I cannot say how much of the cost base flexes with a smaller paying audience.
Sports is the part of Disney I would still call unproven. The Entertainment engine has shown it can earn a margin, and the parks earn one every quarter. ESPN is where the old bundle economics either survive in a new form or do not.
What the analysts and the grade are measuring
Of 19 analysts, 95% rate Disney a buy and none rate it a sell. The consensus page shows an average target of $128, about 25% above the current price, and even the lowest target of $111 is about 8% higher. In August, J.P. Morgan cut its target to $137 while keeping its buy rating, Goldman Sachs held at $144 and Morgan Stanley at $125.
The quant rating says something different. It is a D with a score of 17, down from a C at 69 on September 8. The model works from price and valuation history, and the shares have slipped from a $107.55 close in August to $102.67 with a 2.5% drop on the latest day, so a weaker trend was always going to show up. It does not read the segment mix, and it cannot tell a margin that is rebuilding from one that is not. I treat the D as a message about the chart, and the analysts’ targets as a message about the business.
What the cash says
Disney generated $10.1 billion of free cash flow in fiscal 2025, which is about 5.7% of its market value at today’s price. It paid $1.8 billion in dividends and spent $3.5 billion on net buybacks, together about 53% of that cash. The semiannual dividend was raised from $0.50 to $0.75 over the last year, a 50% increase, which leaves the yield near 1.5%.
| Fiscal 2025 cash item | $ billions | Note |
|---|---|---|
| Free cash flow | 10.1 | Operating cash flow after capital spending |
| Dividends paid | 1.8 | Semiannual payout raised from $0.50 to $0.75 |
| Net share repurchases | 3.5 | Net of issuance |
| Returned to shareholders | 5.3 | About 53% of free cash flow |
| Free cash flow yield | 5.7% | Against the current market value of about $177 billion |
None of this makes the shares cheap on its own. It does mean the company is not straining to fund the transition. It can pay shareholders, invest in the parks and still have cash left, which lowers the risk that a slow year in sports forces a painful choice. A new CEO has also outlined a $60 billion investment strategy, according to a headline in our news feed, and I do not know how it splits between parks and content. The answer changes how I would read the spending, so it is one of the things I want the next report to clarify.
What I would watch before the next report
The next report should settle most of this. Direct-to-consumer margin needs to stay near 13% once the marketing and programming timing fades. Sports operating income has to climb back from $858 million in a quarter with no unusually short playoff to blame. And quarterly net income should hold in a range of $2.5 billion to $3 billion, which would tell me the drop was a comparison and not a trend.
The stock has moved after each of its last four reports by +3.6%, +7.5%, -7.4% and -7.7%, so nobody should treat the report day as a formality. My judgment is that Disney is being priced as if the transition were still in doubt, when the evidence says the doubt has narrowed to one segment. If sports holds, the forward multiple is too low. If it slips again, the D grade will have been right for the wrong reason.
Financial disclaimer: The content on StockVane is for educational and informational purposes only and should not be construed as professional financial advice. Stock market investing involves risk of loss.