
If you’ve bought the same stock more than once, averaging into a position over time, buying more after a dip, dollar-cost averaging into a name you believe in for the long run, you already know the mental math gets messy fast. The Dollar-Cost Averaging Calculator is the companion tool for planning that kind of recurring buying before you’re several lots in. Costco is the kind of steady compounder people actually do this with. Three lots at three different prices and three different share counts isn’t hard math individually, but it’s exactly the kind of math where a small arithmetic slip in your head produces a cost basis that’s off by a dollar or two, which then throws off every profit calculation downstream from it.
This stock average calculator does the weighted average math for you across as many lots as you’ve actually bought, and tells you your true average cost per share, your total shares held, your total capital deployed, and, if you enter the current stock market price, your unrealized gain or loss on the whole position at once. It’s the tool I’d want open in a second tab any time I’m deciding whether to add to a position that’s moved against me, because “should I average down” is a question that cannot be answered without knowing your new blended cost basis first.
📈 Stock Average Calculator
Calculate your average stock price after buying additional shares and instantly view your profit/loss.
How to Use It
Add a row for every separate purchase (lot), different price, different date, doesn’t matter, each one gets its own entry. Enter the price per share and the number of shares for each lot. You can add as many lots as you need; there’s no practical limit built into the tool.
Current stock market price (optional), if you fill this in, the calculator layers on your unrealized profit or loss at today’s market value, on top of the average cost math. Leave it blank if you just want the blended cost basis without a live P&L attached.
Hit calculate and you’ll get your average cost per share, total shares held, total capital invested, and, if you supplied a current price, your unrealized gain/loss in both dollars and percentage terms.
Where People Actually Screw This Up
Assuming average cost is just the average of the prices you paid. It isn’t, unless you bought the exact same number of shares every single time. If you bought 10 shares at $100 and 90 shares at $50, your average cost is not $75, it’s much closer to $55, because the second, cheaper, much larger lot pulls the weighted average down hard. This is the most common misunderstanding I see, and it matters because an incorrect average cost means every profit/loss calculation built on top of it is wrong too.
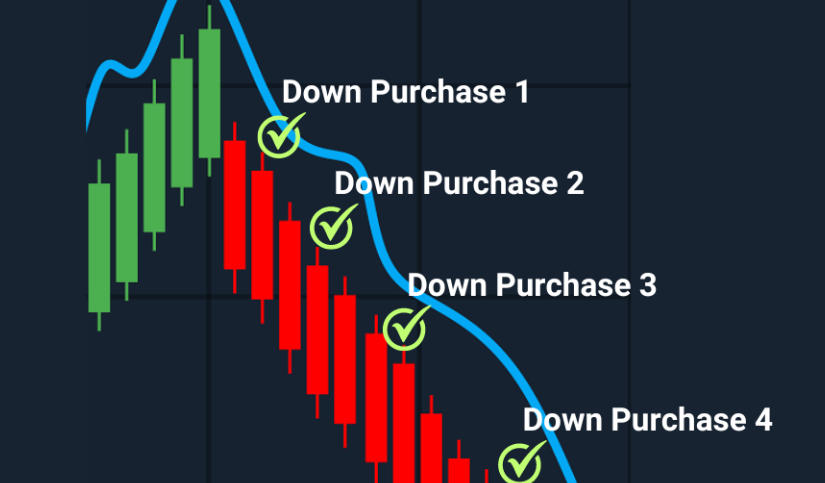
Thinking “averaging down” automatically improves your position. Buying more shares at a lower market price does lower your average cost, that part’s just math. It does not mean the original thesis for owning the stock was right, nor does it mean the stock is now a better buy than it was before it dropped. Averaging down on a name whose fundamentals deteriorated is just a slower, more expensive way of losing more money. Averaging down on a name you still believe in, where the market simply got emotional and overshot to the downside, is a completely different decision wearing the same math. The calculator can’t tell you which situation you’re in, that judgment call is still entirely yours.
Forgetting commissions when tallying total capital invested. If your broker charges per-trade or per-share fees, each additional lot you buy adds a small cost that technically belongs in your true cost basis. On a handful of trades it’s a rounding error. Across a dozen small averaging purchases over months, it adds up more than most people expect, worth checking against the stock profit calculator on this site if commission drag is a real factor in your trading style.
Confusing average cost with breakeven price. They’re related but not identical once taxes, dividends received, or commissions on the eventual sale get involved. Average cost is what you paid, on average, per share. Breakeven is the price at which you’d walk away with exactly zero profit after every cost is accounted for, including the sell-side commission. For most retail investors trading on low or zero commission platforms, these two numbers are close enough not to matter, but they’re conceptually distinct, and mixing them up in a spreadsheet is an easy way to overestimate how far a stock actually needs to recover.
Ignoring what averaging into a losing position does to concentration risk. Every additional lot you buy in a stock that’s dropping increases how much of your total market exposure is tied up in one name, even as the mental framing (“I’m lowering my average cost”) feels defensively minded. It’s worth checking your total position size against your overall portfolio, not just against your own average cost, before adding another lot, a tool that shows a friendlier average cost number can quietly mask a position that’s grown uncomfortably large relative to everything else you own in the market.
Quick Reference
Average cost (cost basis), the weighted average price paid per share across all lots, calculated as total dollars invested divided by total shares owned.
Dollar-cost averaging (DCA), a strategy of investing a fixed dollar amount on a regular schedule regardless of price, which naturally buys more shares when the market is down and fewer when it’s up, smoothing out the average cost over time.
Averaging down, specifically buying additional shares of a stock after its market price has dropped below your existing average cost, done deliberately to lower that average cost.
Unrealized gain/loss, the paper profit or loss on a position you still hold, based on the difference between current market price and your average cost. It only becomes a realized gain or loss once you actually sell.
Frequently Asked Questions
Does this calculator work for dividend reinvestment (DRIP) purchases too?
Yes, each reinvested dividend that buys additional shares is functionally just another lot at whatever the reinvestment price was that period. Add it as its own row with its price and share count, same as a manual purchase, and it’ll fold correctly into the weighted average.
How is average cost different from what my brokerage shows on my portfolio screen?
Most brokerages calculate this the same weighted-average way, so the numbers should match closely. Small discrepancies usually come from whether commissions were rolled into the cost basis, whether a stock split occurred and was adjusted retroactively, or whether the broker is using a different accounting method like FIFO or specific lot identification for tax purposes, which affects which shares are considered “sold” first but doesn’t actually change your blended average cost across the whole position.
Should I average down on every stock that drops, or only sometimes?
Only when the reason you bought the stock in the first place still holds up, averaging down works best as a deliberate response to a market overreaction on a name you’ve researched and still believe in, not as a reflexive habit applied to every red position in your account. A lower average cost doesn’t fix a broken thesis; it just means you’re more exposed to a broken thesis than you were before.
Can I use this calculator for options contracts instead of shares?
Not directly, this tool is built around whole shares and share-based average cost. Options pricing involves premium, strike, and contract multipliers that behave differently, and averaging into an options position (rolling or adding contracts) needs its own framework. The options profit calculator on this site handles options-specific payoff math instead.
What happens if I accidentally enter a stock split incorrectly across my lots?
If a stock split after some of your purchases but before others, your older lots’ share counts and prices need to be adjusted to post-split terms before entering them here, or your weighted average will be distorted. A 2-for-1 split means you’d double the share count and halve the price per share for any lot purchased before the split date, do that adjustment first, then enter all lots in consistent post-split terms.
Financial Disclaimer: The content on StockVane is for educational and informational purposes only and should not be construed as professional financial advice. Stock market investing involves risk of loss.