
Tesla stock generates more vivid moments than almost any other, and most of the money retail investors lose on it is lost reacting to one of them. The last two months alone supplied five clean examples, each visible in the price and financial data.
This is not a case for or against the company. Each habit below costs money whichever side you are on, and each comes with a check you can run in a few minutes.
Calls struck above every analyst target
Tesla trades at about $364. A call struck 65% above that price, roughly $601, is a bet that the stock will rise well past the highest price target any covering analyst has published, which is $505. It needs a move of about 65% just to reach the strike, and more than that to profit. The premium looks small, which is why people buy it, and the odds are small for the same reason.
People weigh the price of the ticket against the size of the prize and skip the probability. A strike near the current price has a break-even you can reason about, and if upside is what you want, that is the better place to look. Run any candidate through our options profit calculator before buying, and check where the strike sits against the 52-week high of $499. If it is above the high and above every analyst target, you are buying a lottery ticket.
The one-day drop that reversed
Tesla reported on July 22. It closed that day at $374.01. The next session it closed at $319.69, down 14.5%, and it kept sliding until July 29, when it closed at $298.32, about 20% below where it started. By August 21 it was back to $362.86, a rebound of 21.6% off the low.
Anyone who sold at the low locked in a 20% loss and missed most of the recovery. The stock ended the stretch only 3% below where it began. I would not read the rebound as proof that the drop was wrong. The point is narrower. A single large move in a stock that regularly makes them is a prompt to check whether the earnings changed, not evidence that they did. The average day-after-report move over the last four reports was about 6%, so a 14.5% move was a big one, and it still reversed most of itself within a month.
It also helps to know what normal looks like for this stock. Over the last 259 trading days, Tesla moved 5% or more in a single session 21 times, ten down and eleven up, and only once did it move as much as 10%, which was the July drop. The stock fell as much as 39% from its December high to the July low. Over the full year it gained about 5%, from $346 to $364. Someone who reacted to every 5% day would have traded roughly every two weeks and ended the year almost where they started.
The revenue line is the easy part
The June quarter looked strong on top. Revenue was $28.2 billion, up 26%. The financials tab shows what sat underneath it: operating profit of $398 million, a 1.4% margin, down 57% from a year earlier. Free cash flow was negative $1.10 billion, because capital spending of about $5.8 billion outran operating cash flow of $4.7 billion.
| Metric | June quarter 2026 | What it says |
|---|---|---|
| Revenue | $28.2 billion (+26%) | The headline number |
| Operating profit | $398 million (1.4% margin) | Down 57% from a year earlier |
| Net income | $1.13 billion | Higher than operating profit; comes from below the operating line |
| Free cash flow | -$1.10 billion | Capital spending outran operating cash flow |
| Trailing P/E | 337x | Against a five-year average near 162x |
Net income was $1.13 billion, which is higher than operating profit. The difference comes from income below the operating line, such as interest, and it is a reminder to read where profit comes from before you read how much of it there is.
The mix matters too. The automotive segment brought in $25.1 billion of the June quarter, about 89%, and energy generation and storage brought in $3.1 billion, about 11%. Gross margin for the full year was 18.0%, against 25.6% in fiscal 2022. A company that sells cars at that margin is exposed to price cuts in a way that a software company is not, and the news feed for September 8 carries a headline about more than ten car brands running price-cut promotions.
The full-year picture is the same. Diluted EPS was $1.08 in fiscal 2025, down from $4.30 in fiscal 2023, a fall of 75%. Operating margin went from 9.2% to 5.1% over the same stretch, on revenue that is 2% lower.
A multiple that resets every day
Daily-reset 2x and 3x funds are built to deliver a multiple of one day’s move, not of a longer stretch. On a volatile stock, the difference is large. The July path is a real example. Tesla fell from $374.01 on July 22 to $298.32 on July 29 and then recovered to $362.86 by August 21, a net loss of 3.0%.
| Holding period, July 22 to August 21 | Tesla shares | 2x daily-reset fund (before fees) |
|---|---|---|
| Worst point (July 29) | -20.2% | -38.3% |
| End of period (August 21) | -3.0% | -9.6% |
A 2x daily-reset fund tracking the same closes would have lost about 9.6% over that stretch, before fees, which is more than three times the stock’s loss, not twice. Daily resets punish a stock that swings both ways, and the loss comes from the path, not from any view on Tesla. Our TQQQ review covers the same mechanics for a Nasdaq fund.
Real funds add fees and financing costs, so the loss on an actual product would be somewhat larger than the table shows. The July stretch is also a fairly gentle test. It lasted a month and the stock finished within 3% of its start. Over a longer period with more reversals, the gap between the stock and the funds built on it would keep widening, which is why these products suit a trade measured in hours or days and not a position held through earnings.
An average target nobody holds
Tesla is one of the most divisive stocks on the analyst consensus page. Of 24 analysts, 46% rate it a buy, 46% a hold and 8% a sell. The average target is $402, about 10% above the price, but that average hides a range from $130 to $505. The lowest target is 64% below the price and the highest is 39% above it.
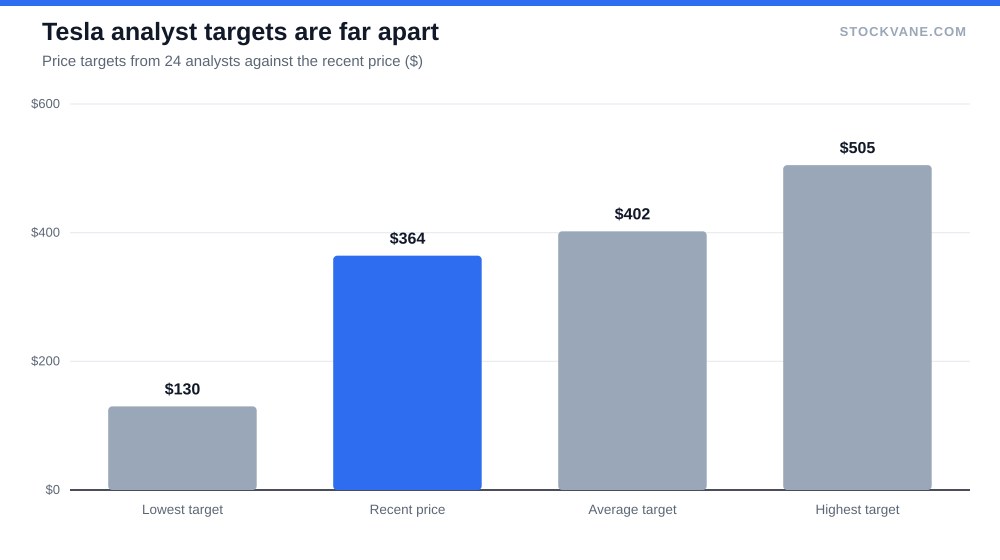
An average taken across a range that wide sits between two camps and matches the view of almost none of the analysts. Buying because the average target is above the price means leaning on a number nobody in the range has published. The quant model on the same page graded Tesla an E with a score of 15 on the latest date, after a D on September 8, so on price behavior alone the stock has been weak.
Headlines make this worse. On September 3 Tesla rose 5.4%, and on September 4 it fell 5.9%. The news feed for September 4 shows the Austin Cybercab launch and a regulator’s probe reported on the same day. Over the two sessions the stock lost 0.8%. Two big moves that cancel out are what acting on a daily headline looks like in practice.
What the valuation asks of you
All five mistakes are easier to make when the multiple is high, because a high multiple requires you to be right about the future in specific ways. The valuation tab shows a trailing P/E of 337, against a five-year average of 162 and a sector average near 52. The forward P/E is 356, which is higher than the trailing figure, so analysts are pricing in roughly flat to lower earnings over the next year.
I do not know how the robotaxi and energy businesses will change that. Nobody does yet, and that uncertainty is the reason the range of targets is so wide. What I can say is that the stock is 27% below its 52-week high and still trades at more than 300 times what it earned over the last twelve months.
Here is a way to feel the size of that gap. At the sector’s average P/E of about 52, a share price of $364 would need earnings of about $7.04 a share. Tesla earned $1.08 over the last twelve months, so earnings would have to rise roughly 6.5 times to bring the stock to a sector-average multiple at today’s price. That can happen through growth, through a lower price, or through some mix of the two, and I have no basis for saying which. It also explains why buyers lean on price-to-sales, which stands at 13.9 against a five-year average of 11.7, since earnings alone cannot support the price. Only about 1.9% of the float is sold short, so the doubt shows up in the analyst targets and not in bets against the stock.
The habit I would build instead
Before acting on a Tesla headline, I would check two things: how far the price has to move for the trade to work, and whether the profit line changed or only the revenue line. If I cannot answer both, I have not learned anything yet.
My own rule at 337 times earnings would be a position small enough that a repeat of July, a 14.5% day that came once in the last year, is an annoyance and not a decision. Everything else on this list follows from that.
Financial disclaimer: The content on StockVane is for educational and informational purposes only and should not be construed as professional financial advice. Stock market investing involves risk of loss.
Sources: Price-to-earnings ratio (SEC Investor.gov glossary) (https://www.investor.gov/introduction-investing/investing-basics/glossary/price-earnings-pe-ratio) · Stock options tax topic (IRS) (https://www.irs.gov/taxtopics/tc427)