
Revenue growth at IBM, fiscal 2020 through 2025, reads -4%, 4%, 6%, 2%, 1%, 8%. Six years, one decline, and a last print that is the best of the run. A stock that carries a twenty-year reputation as a value trap has now put together five straight years of growth, and the market price is $230, 30.5% below the 52-week high of $330.
I use the same screen on every name, described in how I pick stocks, and IBM is a useful test of it. I have owned the label “value trap” for IBM in my own head longer than I would like to admit. The question in the title is whether the label still fits. My answer: the business stopped shrinking and the margins are the real change, but the stock has already been paid for part of that, and the next two prints decide whether the rest is deserved.
What the old trap looked like
The IBM quote page shows the long shape of the price. A value trap needs two ingredients: a low multiple and a falling earnings base. IBM had both for most of the 2010s, and the multiple never did the work, because the denominator kept moving. Divestitures (the PC unit, chip manufacturing, and the managed infrastructure business spun out as Kyndryl) trimmed revenue on purpose. That was the right strategy. It also meant the top line looked terrible for years while management asked investors to look through it.
The DB history I can verify starts at fiscal 2020, when revenue was $55.2 billion, down 4%. By 2025 it was $67.5 billion, which is 22% above 2020. Growth was uneven: 4%, 6%, 2%, 1%, then 8% in the last fiscal year. Nothing in that sequence looks like a rocket. It looks like a company that stopped bleeding.
The margin story is stronger than the revenue story
Revenue is the headline. Margin is where I would put the weight. Gross margin went from 48.3% in 2020 to 58.2% in 2025, and operating income rose from $4.7 billion to $12.5 billion, which is 2.7 times the 2020 figure on revenue that is up only about a fifth. In fiscal 2025 the operating margin was 18%, computed as operating income over revenue.
That gap between 22% revenue growth and a 2.7-fold operating profit is what a mix shift toward software looks like in numbers. The latest reported quarter (the one that ended in June, reported on 2026-07-22) split $17.2 billion of revenue into software at $7.76 billion (45%), consulting at $5.33 billion (31%), and infrastructure at $3.84 billion (22%), with financing and other making up the small remainder. Software is the largest piece and the piece that carries the multiple argument. The Oracle backlog post is a useful contrast, since it covers a company where a contracted pipeline is the entire case, and IBM’s software line is a slower-moving version of the same question.
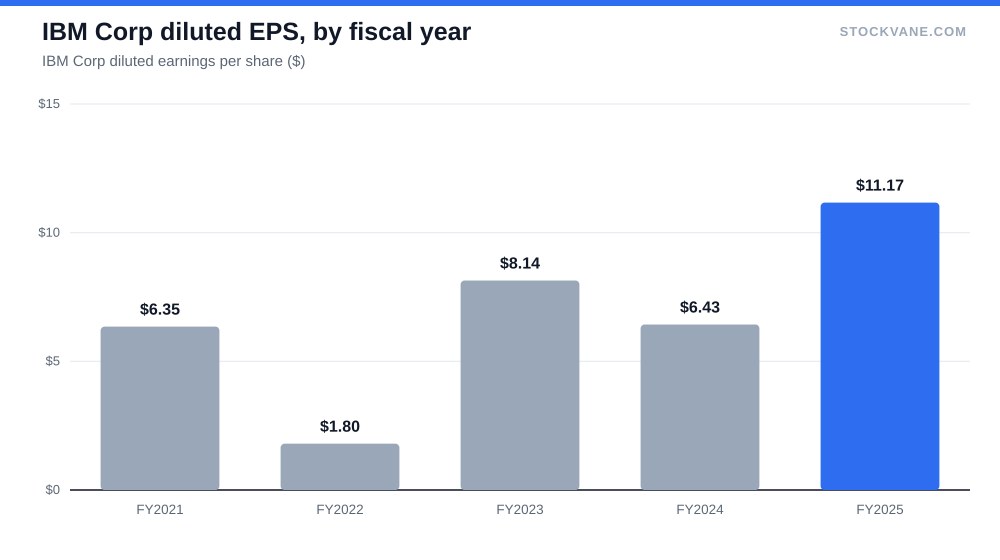
The margin path was not smooth. The DB shows EBIT margin of 8.1% in 2020, 10.5% in 2021, a dip to 3.9% in 2022, then 16.7%, 12.0%, and 18.2% in 2025. The 2022 dip lines up with earnings per share of $1.80 that year, against $11.17 in 2025. I would not cite the 2022 number as a trend. It is an outlier that matters for one reason, covered next.
| Metric | Value | Context |
|---|---|---|
| Price (approx.) | $229.55 | 52-week range $198 to $330 |
| P/E (TTM) | 20.3x | Five-year average 37.3x |
| Price-to-sales | 3.4x | Five-year average 2.7x |
| Analyst ratings | 67% buy, 28% hold | 18 analysts; average target $262 |
| Dividend yield | 2.93% |
The table above puts the six fiscal years side by side. Read the operating income column against the revenue column: the first one moved roughly three times as far as the second, and that ratio is the whole thesis.
Why the five-year average P/E lies
IBM’s trailing P/E is 20.3 and the current-period reading is 22.1, against a five-year average of 37.3. On that comparison the stock looks about 40% cheaper than its own history. I do not trust it. The five-year average is inflated by 2022, when depressed earnings pushed the multiple into the band’s top range (the DB band runs 14.9 to 59.7). Take the trough year out and the comparison looks a lot less dramatic.
Other gauges say something different. Price to sales is 3.4 against a five-year average of 2.7, at the 73rd percentile of its own range. Price to book is 6.8 against 7.0. So on sales, IBM is not cheap versus its own past. It is priced like a business that now deserves a higher revenue multiple because the margin mix improved. That is a defensible view, and it is also exactly the point where a value investor should stop calling it a value stock.
The forward numbers add a wrinkle. Forward EPS is $10.13, below the trailing $11.29, and the forward P/E is 22.7. I read the lower forward figure as analysts expecting the recent profit level to be hard to repeat, which fits the drop from 2025 net income of $10.6 billion (up 76% from $6.0 billion). A jump that large invites a fade. I would rather find that out from the October print than assume it.
Where the turnaround is being tested
The last two quarters set the tone. Sales of $16.3 billion and $19.7 billion in the two quarters of calendar 2025 grew 9% and 12%. The March quarter grew 9%. The June quarter, $17.2 billion, grew 1%. That is a sharp step down, and it is why I would not call the turnaround proven. One soft quarter in a company this size may be timing, or comparison noise, or a deal that closed the year before. I cannot tell which from the data I have, so I treat it as an open question. If growth stays near 1% in the September quarter, the story becomes “margin gains on flat revenue,” which is a real story, but a cap on the multiple.
The market reaction has been muted at the good end and sharp at the bad end. The stock moved +0.4% after the July 22 report and fell about 8.3% after the April report, against an average earnings-day move of 3.7%. Investors are punishing disappointment and not paying for reassurance. The next report is on October 21.
There is also the dividend, which is where most IBM holders come in. The yield is 2.93% on $6.73 a year. Against 2025 EPS of $11.17 that is roughly a 60% payout, which is comfortable. The dividend is not what worries me. It is the stock’s dependence on the software mix continuing to grow.
A comparison worth making
Consider what a holder needed to believe five years ago. In fiscal 2021 IBM earned $6.87 billion of operating income on $57.4 billion of revenue, a 12% margin. To get to today’s 18% margin the company had to add about $5.6 billion of operating profit in four years while adding only $10.2 billion of revenue. That is a bit more than half of each incremental revenue dollar reaching operating income. It is a rate a services-heavy company cannot sustain for long, and it is the reason I would give the margin more weight than the sales line, and the reason I would also fear a reversal in mix more than a miss on growth.
Net income tells a rougher story. It ran 5.59, 5.74, 1.64, 7.50, 6.02 and 10.59 billion dollars from 2020 through 2025. Only three of those six years came in within about 20% of the year before. When reported profit swings that much, the multiple you pay is really a bet on which year is normal. My reading is that 2025’s $10.6 billion is at the high end of normal, not the new floor.
What the Street sees
Of 18 analysts, 67% rate it a buy. The average target is $262, which is 14% above the current price, with a range from $191 (-17%) to $350 (+52%). A high-low spread of that width tells me the group has no consensus on which IBM shows up next year. The quant rating in the DB has slipped from C to D over recent weeks, which is a momentum and revisions signal, not a verdict on the business. Short interest is 2.3% of float, low enough to rule out a squeeze story.
How much weight to put on that grade against fundamentals is a judgment call.
The counter-case
The best argument against the turnaround is that IBM is a slow-growth company rebranded by a margin surge that cannot repeat. Gross margin is now 58.2%, already up 1.5 points in a year, and there is a ceiling on how much further a mix shift can lift it. IBM’s earnings are not a capex story, so the AI capex bubble piece applies here in reverse: no dependence on that spending cycle continuing, which is both the appeal and the ceiling. If operating income stalls near $12.5 billion while revenue grows 1% to 3%, the stock’s 22.1 multiple has nothing to expand on.
I am not covering acquisition accounting, free cash flow, or the balance sheet here. The DB history I used does not include enough detail to judge them, and I would rather leave them out than guess. A separate look at cash conversion would be the right next step.
The margin I would not let slip below 58%
I would call it a real turnaround in the operating sense: revenue up in five straight years, gross margin at 58.2%, operating profit almost triple 2020. I would not call it a value stock any more, at 3.4 times sales and the 73rd percentile of its own range. The trade from here is whether IBM can keep its gross margin at or above 58% while revenue growth gets back above 5%. If the October 21 report shows gross margin below 57% or a second quarter of growth near 1%, I would stop calling this a turnaround and go back to calling it a dividend.
Financial disclaimer: The content on StockVane is for educational and informational purposes only and should not be construed as professional financial advice. Stock market investing involves risk of loss.
Sources: IBM SEC filings (EDGAR) (https://www.sec.gov/cgi-bin/browse-edgar?action=getcompany&company=international+business+machines&type=10-K&dateb=&owner=include&count=10).