
On Friday, September 18, Robinhood shares rose 9.1% and 39.4 million of them changed hands. The day before, 21.9 million had traded. That is a real jump in activity, about 1.4 times the stock’s average day over the past year, and it is the kind of tape that makes the volume story feel airtight.
Then look at the longer window. The 20-day average is 24.7 million shares a day, against 27.8 million over the past 250 sessions. The most recent month of trading in the stock itself is running 11% below its own year.
I raise this because the title of this piece repeats what the coverage keeps saying: that trading volume at Robinhood is booming. Some of it is probably true. Crypto, options and equity activity on the platform are what pay the bills, and I cannot see them here. For how the app itself compares with a rival, our Moomoo vs Robinhood comparison is the place to go. The database I work from has no Robinhood platform metrics, no monthly operating data, no funded-customer counts. What it has is the price and volume of the shares, the financial statements, the valuation history and our Quant Rating. So I tested the premise where I can, in the stock, and I will be plain about what I could not test.
What the shares themselves say about volume
A stock’s own turnover is not the same thing as the business’s activity, and the two can move apart for months. Still, it is the one volume series a shareholder actually trades against. Here is how it looks by month.
Average daily volume in September 2025 was 49.5 million shares. It fell to 18.4 million in August 2026, the quietest month in the past year, and has recovered to about 25 million in the latest 20 sessions. The single heaviest day in the record for the past year, 202.4 million shares, came on September 19, 2025, almost exactly a year before the September 18 print. The comparison matters. That single day was 8.2 times the current 20-day average. The stock closed on September 18, 2025 at $120.91, and it closed on September 18, 2026 at $119.82. A year of round-tripping, with -0.9% to show for it.
So here is my reading of the premise. Activity in the underlying business may well be strong. Activity in the stock is ordinary, with one loud day. A 39-million-share Friday on a 9.1% gain is a burst, not a regime.
The turnaround underneath is not in doubt
None of this is a case against the company. Operating margin, on the database’s EBIT margin, went from negative 90.4% in 2021 to negative 71.1% in 2022, to negative 28.5% in 2023, then to positive 35.8% in 2024 and 46.8% in 2025. Robinhood spent four years burning cash at roughly the pace of its own sales and then converted nearly half of each revenue dollar into operating profit.
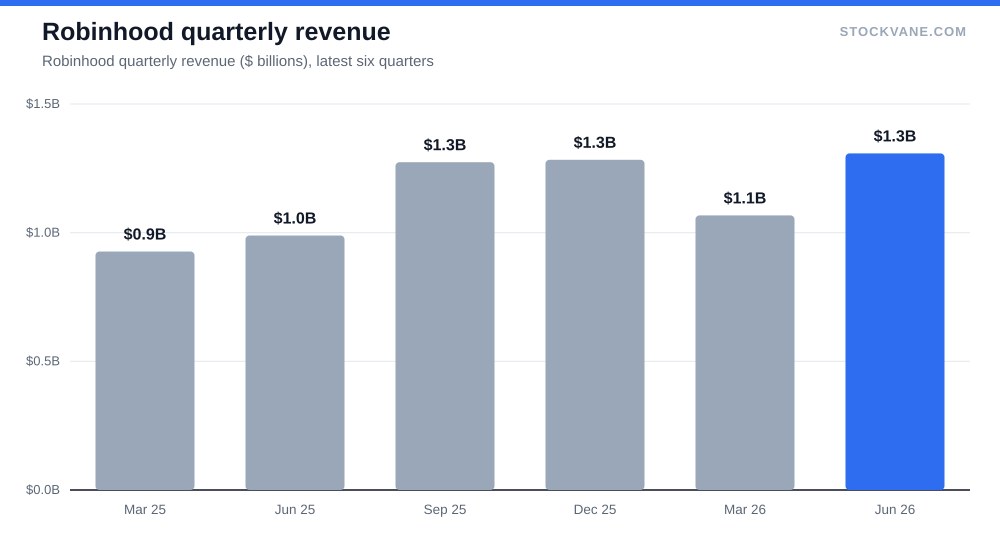
Revenue did that work with growth rather than cuts. It went from $1.4 billion in 2022 to $4.5 billion in 2025, and 2025 alone grew 52% after a 58% year before it. Gross margin moved from 82.9% to 83.3%, so the mix is not eroding underneath the headline. The latest quarter brought in $1.3 billion, up 32% from a year earlier and 23% above the prior quarter, which annualizes to about $5.2 billion. Net income was $1.9 billion for the year against $1.4 billion the year before, a 42% net margin.
I would not argue with any of that. The financials tab has the full six-year run, and it is one of the cleaner improvement stories in the database.
Why the quant score stays at D
The StockVane Quant Rating measures how a stock has behaved and how it is priced against its own record, not how good the company is. Robinhood has held a D throughout the past week, and the numerical score under that letter has been unstable: 49 on September 14, 50 on September 15, 20 on September 16, 18 on September 17 and 30 in the latest reading. That is a wide swing inside a single grade, and it tells me the model is reacting to price and valuation inputs that moved fast, not to a fresh view of the business.
Three inputs explain most of the skepticism, as I read them.
The first is what happens around earnings. Robinhood has fallen after each of its last four reports: 10.8% on November 5, 2025, 8.9% on February 10, 13.2% on April 28 and 3.6% on July 29. The average absolute move is 9.1%. A company can beat and still fall four times in a row when the price already assumes the beat. That is a valuation statement, and it lines up with the second input.
The second is the multiple, laid out on the valuation tab. The trailing P/E is 53.0 on $2.26 of earnings per share, and the five-year average P/E is 24.7. Price-to-sales is 20.0 against a five-year average of 12.2, and price-to-book is 10.4 against 4.0. On all three, the stock sits well above its own history. Analysts’ forward EPS of $2.65 implies 17% growth and a forward P/E of 45.1. Rich, but not the multiple of a company whose earnings are about to double.
The third is the path. Look at the price changes to $119.82: +31% over one month, +11% over three, +60% over six, -0.9% over twelve. A stock that is up 60% in six months and flat over a year is a stock that has spent the year going nowhere in a loud way. It ended the week 22.1% below its 52-week high of $154, after touching $64 on the way down.
| Metric | Value | Context |
|---|---|---|
| Price (approx.) | $119.82 | 52-week range $64 to $154 |
| P/E (TTM) | 53.0x | Five-year average 24.7x |
| Price-to-sales | 20.0x | Five-year average 12.2x |
| Analyst ratings | 89% buy, 11% hold | 19 analysts; average target $134 |
The counter-case I take seriously
The best argument against my caution is the one the stock made on Friday. The SEC’s approval of tokenized stock trading was in the news feed on September 17, and a headline the day before reported that Robinhood’s own blockchain had caught Solana in transaction activity in 11 weeks. I cannot tell you that either one caused a single dollar of Friday’s move, and I will not pretend to. The news feed lists them; it does not say what buyers were thinking.
But suppose they matter. New products, if they scale, are how a business earning 47 cents of operating profit per revenue dollar grows into a multiple that looks steep today. Consider the arithmetic. At the current price, reaching the five-year average P/E of 24.7 requires trailing EPS of about $4.85, roughly 2.1 times the current $2.26. At 17% a year, which is what consensus implies, that takes 4.9 years with the price standing still. At 30%, 2.9 years. Neither is impossible. The second one needs revenue to keep compounding well above the trend implied by a company that just printed +32% in a quarter.
Analysts are mostly with the bulls. Of 19 covering, 89% rate the stock a buy, and the average target of $134 sits 12% above the price. The lowest target, $100, is 17% below it, and the highest, $165, is 38% above. A range that wide is what you get when a company’s earnings are moving as fast as its price. Short interest is small, 4.0% of float at the end of August, with about 1.7 days to cover, so there is no squeeze case hiding here either.
What I am not covering
Nothing here measures how many customers use the app, how many contracts they trade, or how much crypto moves through it. If Robinhood’s operating data show something the share price does not, that would be the gap that makes the volume claim true. I would read it in the company’s own reports rather than trust a headline about it. My scope is the stock: how it trades, how it is priced, and what our model does with both. Broker comparisons live elsewhere on the site, and the Moomoo comparison linked earlier is the one to read if the question is about the app rather than the shares. For a wider set of tech names I would treat with similar care, see Which Tech Stocks Are Worth Buying Cautiously in Q4 2026.
The number that would change my grade
I would not move off caution because of one heavy Friday, and a D on a company with a 47% margin is not a claim that the business is weak. It is a claim that the price has borrowed from the future. The evidence that would change my mind is specific. First, a 20-day average volume that holds above its 250-day average of 27.8 million shares while the price holds above $120, which would say the buying has staying power. Second, a report in which the stock rises on the print instead of falling: the November quarter would be the first chance to break a four-report streak of declines averaging 9.1%. And third, trailing EPS moving from $2.26 toward $3, at which point the same $119.82 share price would carry a multiple near 40.
Until then, I am treating the volume boom as unproven in the stock and the D as an honest reading of the price.
Financial disclaimer: The content on StockVane is for educational and informational purposes only and should not be construed as professional financial advice. Stock market investing involves risk of loss.
Sources: Price-to-earnings ratio (SEC Investor.gov glossary) (https://www.investor.gov/introduction-investing/investing-basics/glossary/price-earnings-pe-ratio) · Stock options tax topic (IRS) (https://www.irs.gov/taxtopics/tc427)